Published: 2026-03-13T00:30:42.000Z
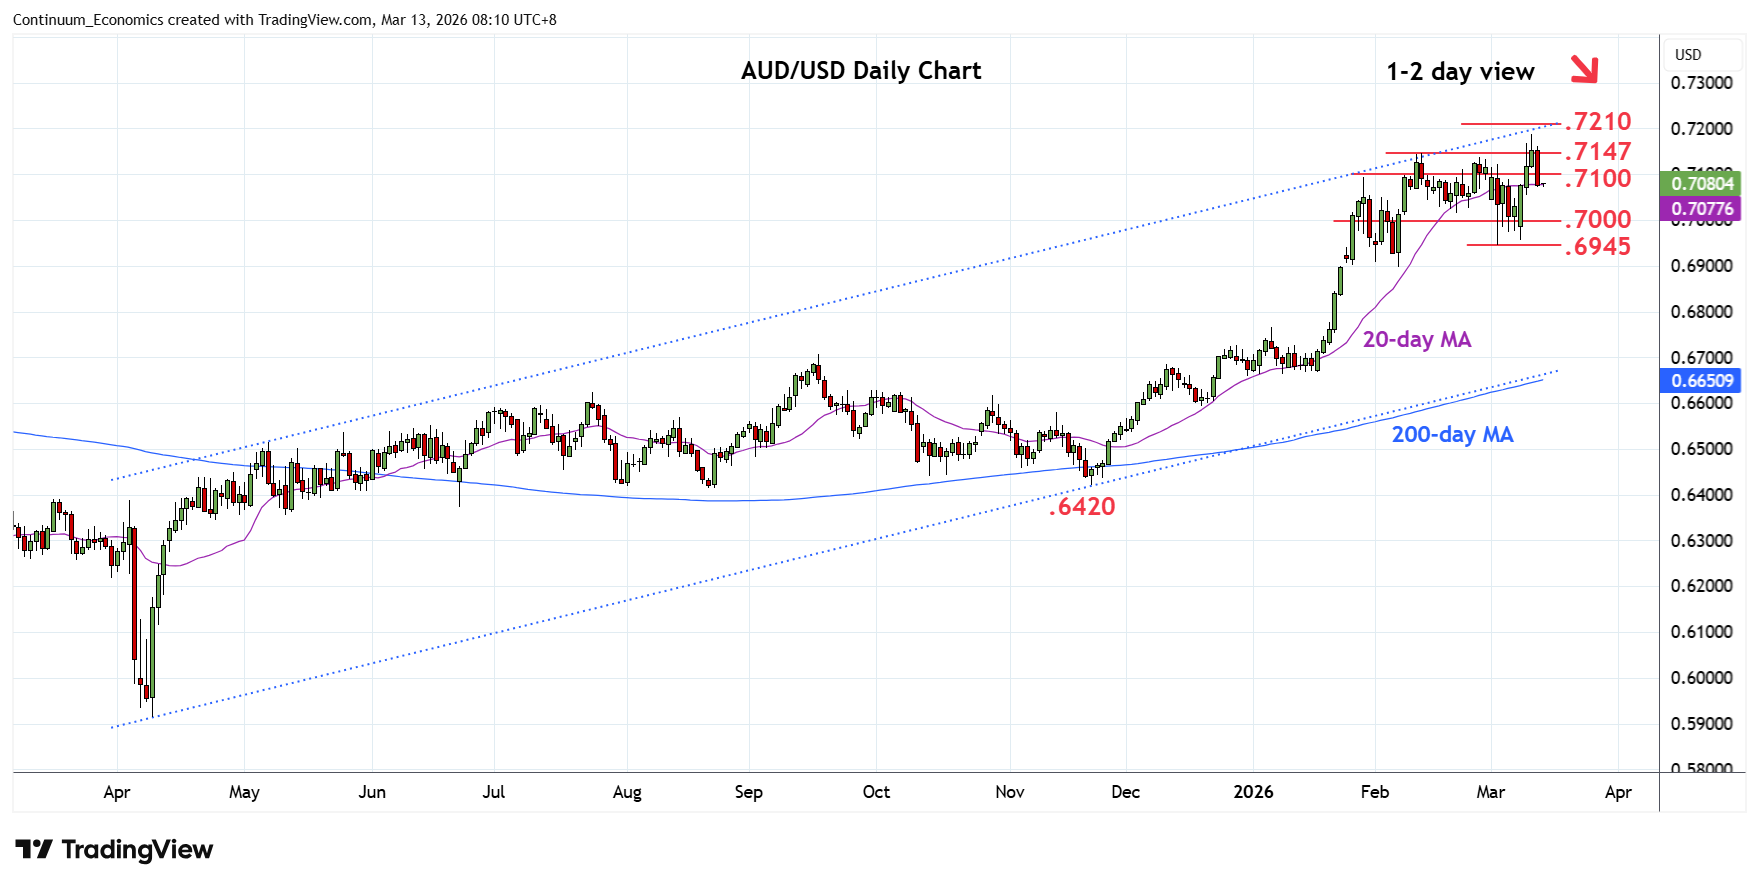
Chart AUD/USD Update: Turned down from channel resistance
-
Turned lower from Wednesday's .7188 just below strong resistance at the .7200/.7210 channel resistance and 61.8% Fibonacci level
| Levels | Imp | Comment | Levels | Imp | Comment | |||
|---|---|---|---|---|---|---|---|---|
| R4 | 0.7285 | * | Jun 2022 high | S1 | 0.7050 | * | congestion | |
| R3 | 0.7200/10 | * | figure, 61.8% | S2 | 0.7015/00 | * | 20 Feb low, congestion | |
| R2 | 0.7188 | ** | 11 Mar YTD high | S3 | 0.6945 | ** | 3 Mar low | |
| R1 | 0.7147 | * | Feb high | S4 | 0.6900 | ** | Feb low, congestion |
Asterisk denotes strength of level
00:20 GMT - Turned lower from Wednesday's .7188 just below strong resistance at the .7200/.7210 channel resistance and 61.8% Fibonacci level as prices gives way to selling pressure to retrace gains from the .6945 swing low. Pullback see prices unwinding overbought intraday and daily studies with break below .7100 level opening up room to the .7015/.7000 area. Break here will turn focus to recent swing lows at .6945/.6900. Meanwhile, resistance is lowered to the .7100/47 area which is now expected to cap and sustain pullback from .7188 high.