Published: 2025-11-26T07:08:17.000Z
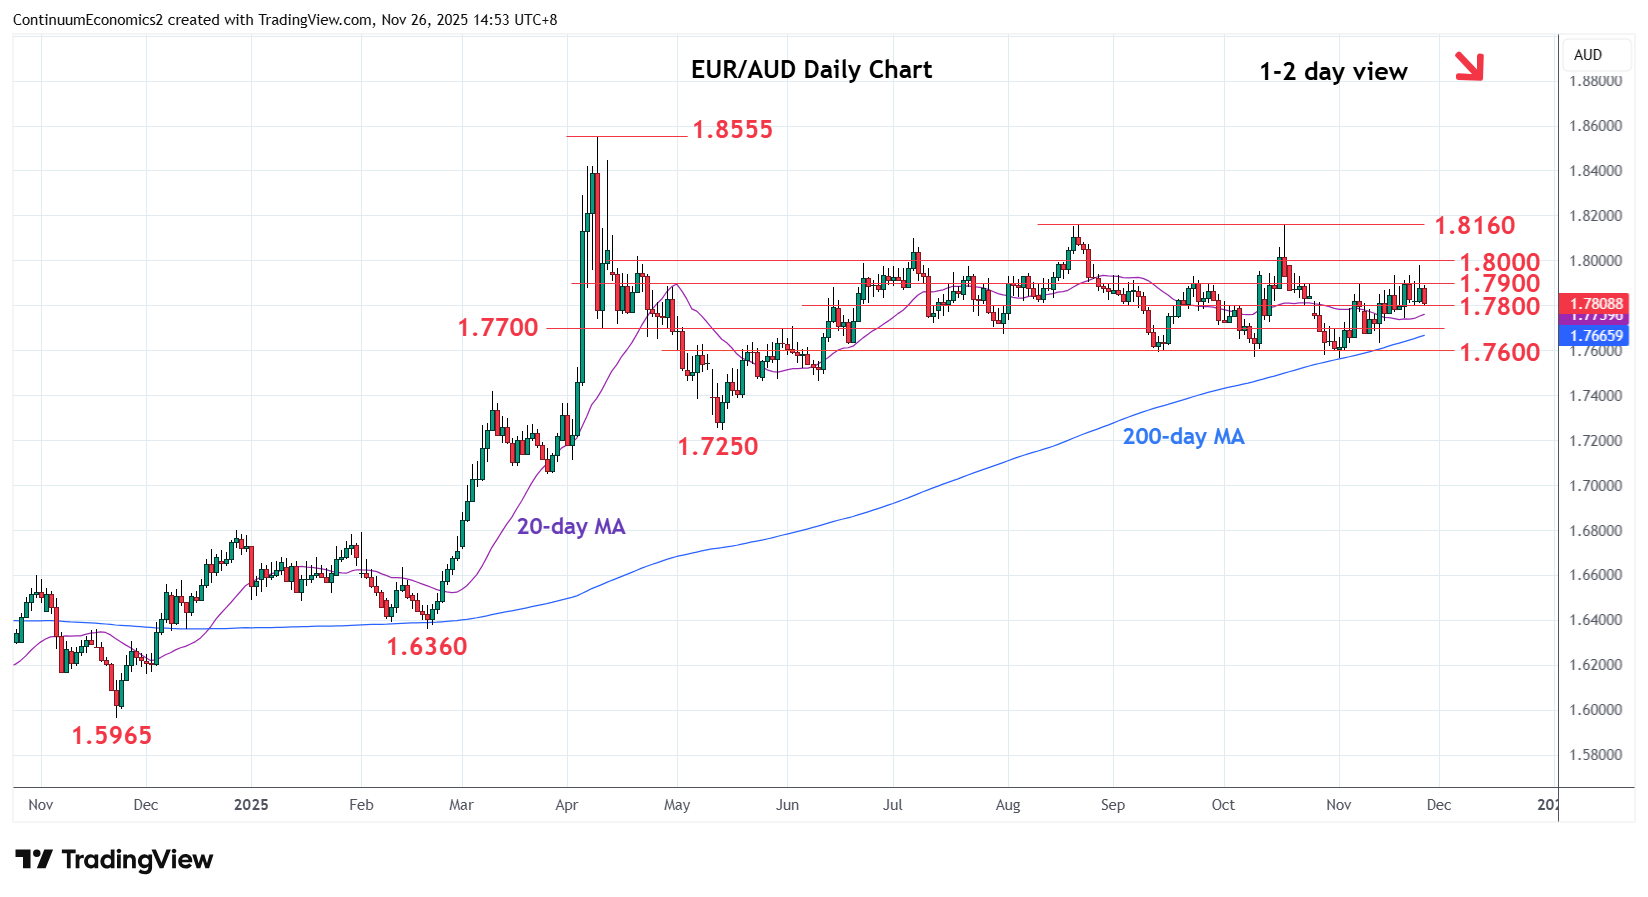
Chart EUR/AUD Update: Under pressure
-
Failure to sustain break above the 1.7900 level see pressure returning to the 1.7800 level
| Levels | Imp | Comment | Levels | Imp | Comment | |||
|---|---|---|---|---|---|---|---|---|
| R4 | 1.8250 | * | 76.4% Apr/May fall | S1 | 1.7800 | * | congestion | |
| R3 | 1.8160 | ** | Aug, Oct highs | S2 | 1.7700 | * | congestion | |
| R2 | 1.8000 | * | figure | S3 | 1.7600 | ** | Sep low, congestion | |
| R1 | 1.7900 | ** | 7 Nov high | S4 | 1.7565 | * | 3 Nov low |
Asterisk denotes strength of level
07:00 GMT - Failure to sustain break above the 1.7900 level see pressure returning to the 1.7800 level. Negative daily studies see risk for break here to open up room for deeper pullback to the 1.7700/1.7600 congestion area then the 1.7565 , 3 November low. Break of the latter will extend the broader losses from the 1.8160 high and see room to support at the 1.7500/1.7460 area and 1.7400 congestion. Meanwhile, resistance at the 1.7900 level and extending to the 1.8000 figure are expected to cap.