Published: 2025-05-29T11:03:14.000Z
Chart USD/ZAR Update: Leaning lower in range

Senior Technical Strategist
-
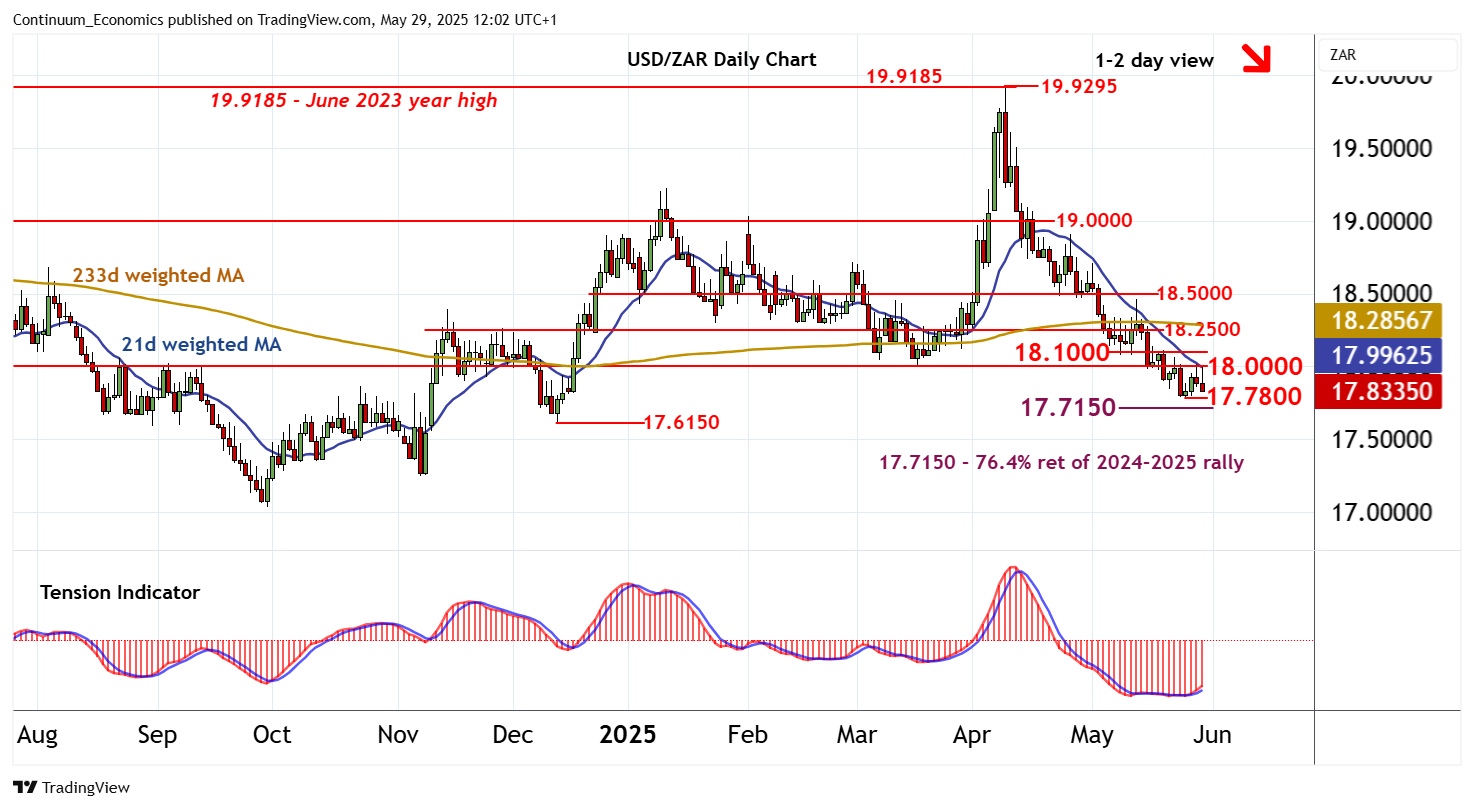
The anticipated retest of congestion resistance at 18.0000 proved short-lived
| Level | Comment | Level | Comment | |||||
|---|---|---|---|---|---|---|---|---|
| R4 | 18.5000 | ** | break level | S1 | 17.7800 | ** | 26 May low | |
| R3 | 18.2500 | * | congestion | S2 | 17.7150 | ** | 76.4% ret of 2024-2025 rally | |
| R2 | 18.1000 | * | break level | S3 | 17.6150 | ** | 12 Dec (m) low | |
| R1 | 18.0000 | ** | congestion | S4 | 17.5000 | * | congestion |
Asterisk denotes strength of level
11:50 BST - The anticipated retest of congestion resistance at 18.0000 proved short-lived, with renewed selling interest putting focus on support at the 17.7800 low of 26 May. Just lower is the 17.7150 Fibonacci retracement. But rising daily readings are expected to limit any initial tests of this range in consolidation, before mixed/negative weekly charts prompt a break. A close below 17.7150 will add weight to sentiment and extend April losses towards the 17.6150 monthly low of 12 December. Meanwhile, resistance remains at 18.0000 - 18.1000 and should cap any immediate tests higher.