Published: 2026-04-01T06:38:44.000Z
Chart EUR/SEK Update: Settling back from test of 11.0000 Fibonacci level
1
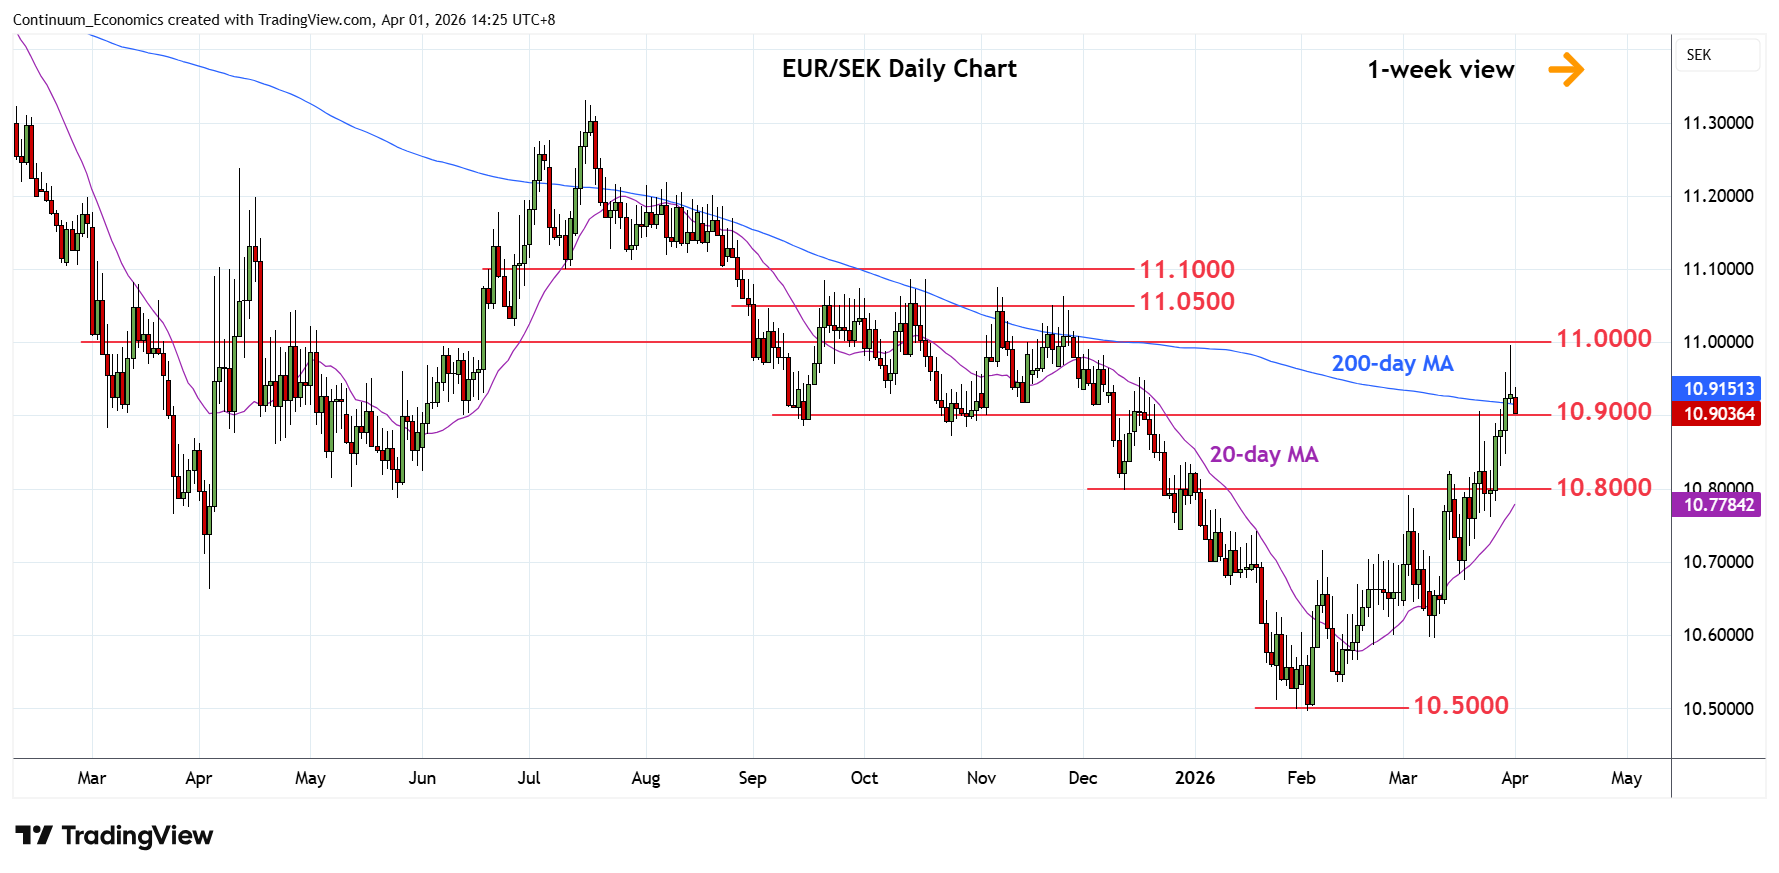
Lower in consolidation beneath the 11.0000 figure and 61.8% Fibonacci retracement
| Levels | Imp | Comment | Levels | Imp | Comment | |||
| R4 | 11.1350 | * | 76.4% Jul/Feb fall | S1 | 10.9000 | * | congestion | |
| R3 | 11.1000 | ** | Jul low | S2 | 10.8500 | * | congestion | |
| R2 | 11.0500 | * | congestion | S3 | 10.8000 | ** | 11 Dec low, congestion | |
| R1 | 11.0000 | * | 61.8% Jul/Feb fall | S4 | 10.7500 | * | 50% Feb/Mar rally |
Asterisk denotes strength of level
06:30 GMT - Lower in consolidation beneath the 11.0000 figure and 61.8% Fibonacci retracement as prices unwind overbought intraday and daily studies. Pullback see support starting at the 10.9000/10.8500 congestion area. Break here will open up room for deeper pullback to retrace gains from the 10.5000 February current year low to support at the 10.8000 congestion. Below this will see room to 10.7500, 50% Fibonacci retracement. Meanwhile, resistance at 11.0000 level expected to cap. Break here will further extend the February low to the 11.0500/11.1000 area.