Published: 2025-02-26T14:32:19.000Z
Chart AUD/USD Update: Room for still lower

Senior Technical Strategist
-
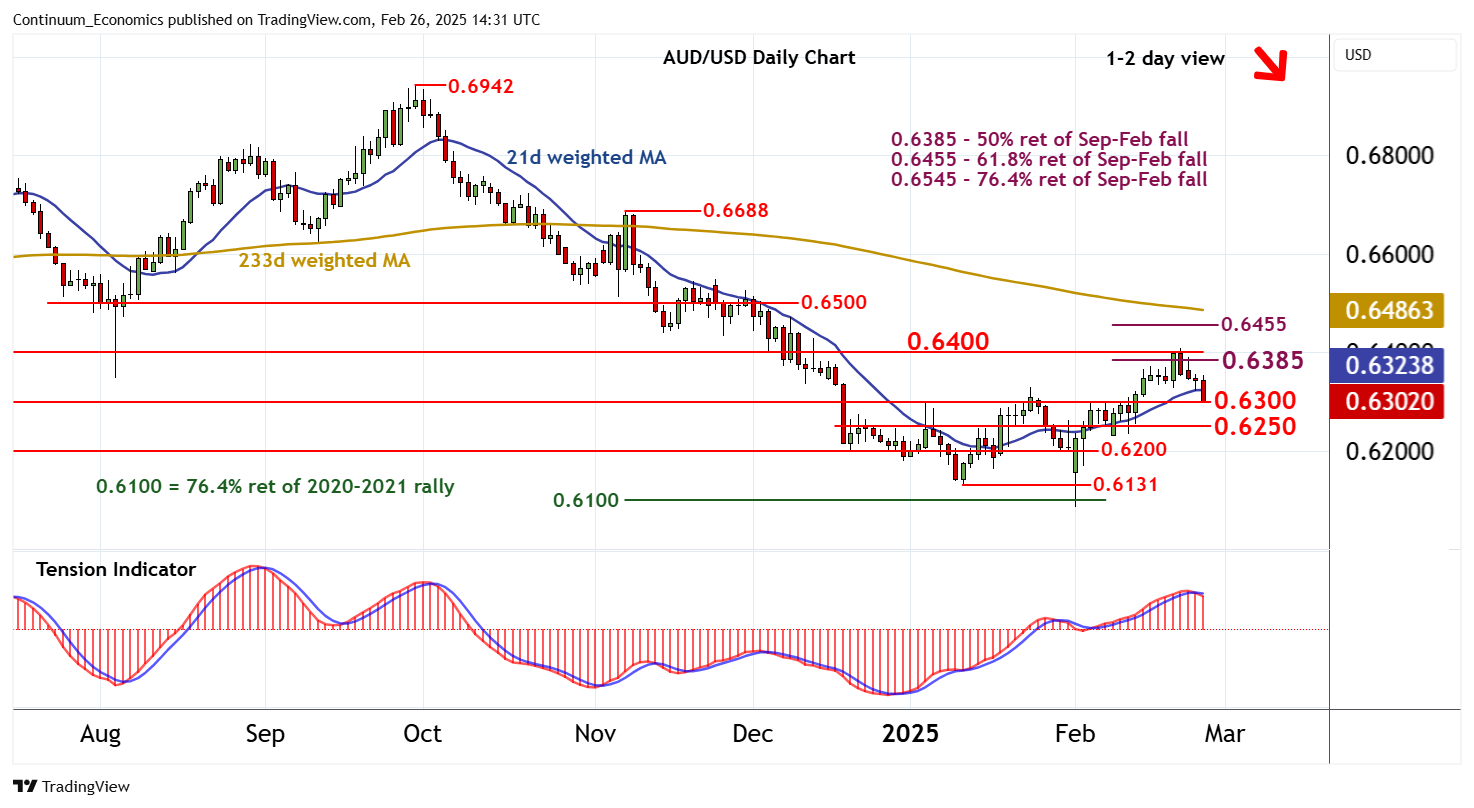
Anticipated losses have reached congestion support at 0.6300
| Levels | Imp | Comment | Levels | Imp | Comment | |||
|---|---|---|---|---|---|---|---|---|
| R4 | 0.6500 | ** | break level | S1 | 0.6300 | ** | congestion | |
| R3 | 0.6455 | ** | 61.8% ret of Sep-Feb fall | S2 | 0.6250 | * | break level | |
| R2 | 0.6400 | ** | break level | S3 | 0.6200 | ** | congestion | |
| R1 | 0.6385 | ** | 50% ret of Sep-Feb fall | S4 | 0.6131 | * | 13 Jan (m) low |
Asterisk denotes strength of level
14:15 GMT - Anticipated losses have reached congestion support at 0.6300. Intraday studies are flat in oversold areas, suggesting potential for short-term consolidation around here, before negative daily readings prompt further losses. A break beneath here will open up support at 0.6250, but rising weekly charts are expected to limit any tests in renewed consolidation. Meanwhile, resistance remains initially at the 0.6385 Fibonacci retracement and should prove difficult to reach in any immediate tests higher.