Published: 2026-01-16T07:46:19.000Z
Chart AUD/NZD Update: Consolidating below 1.1690 high
-
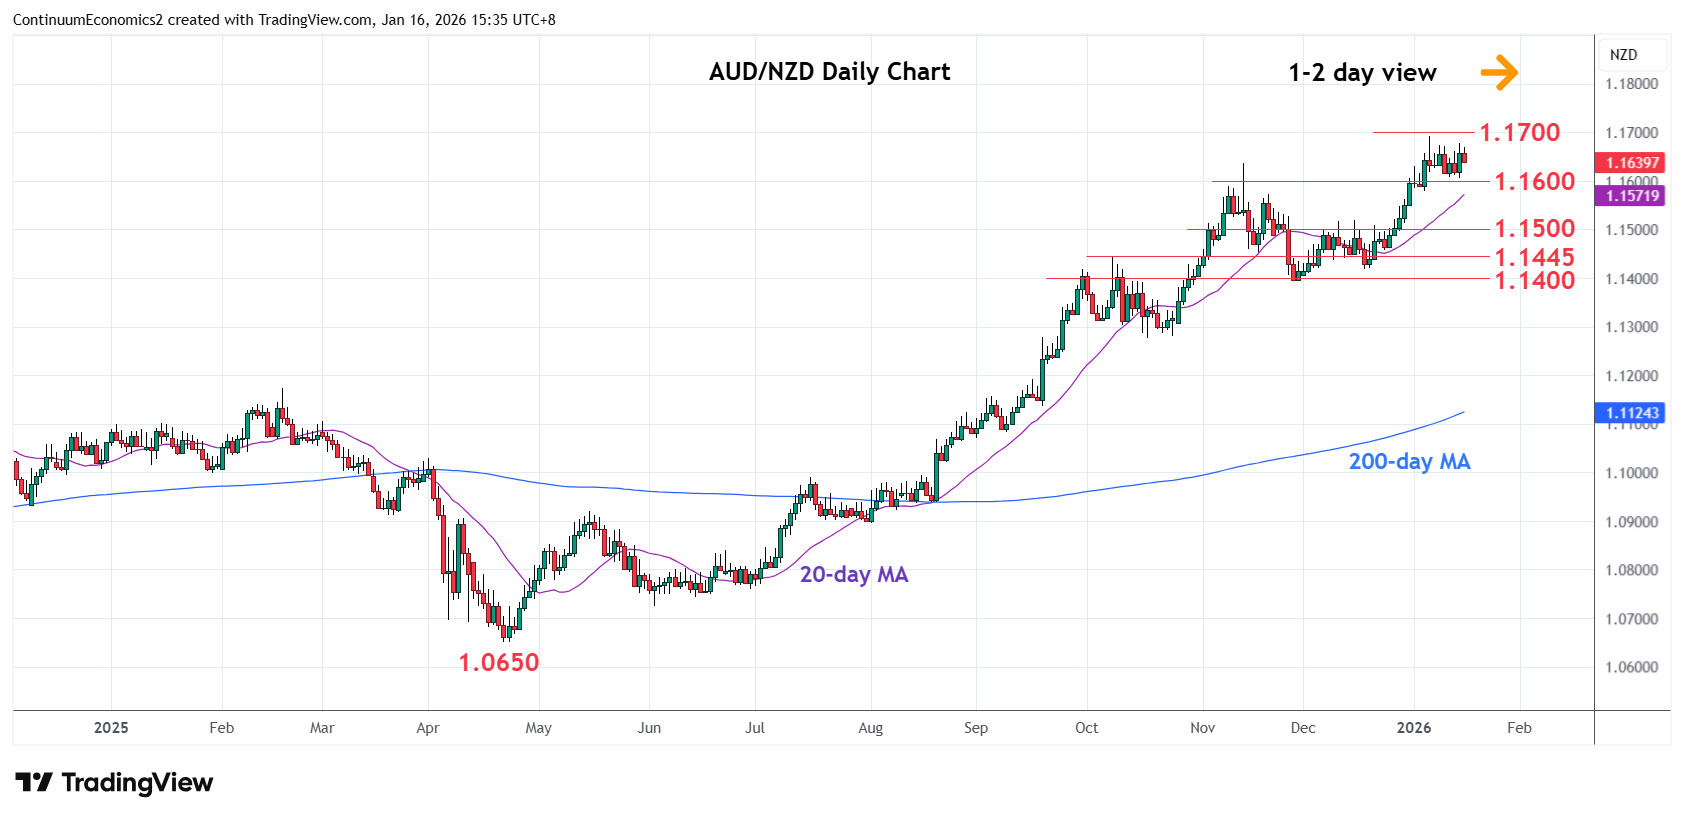
Choppy trade from the 1.1690 high of last week see prices consolidating rally from the November low
| Level | Comment | Level | Comment | |||||
|---|---|---|---|---|---|---|---|---|
| R4 | 1.2000 | ** | figure, congestion | S1 | 1.1600 | * | congestion | |
| R3 | 1.1900 | * | 50% 2011/2020 fall | S2 | 1.1500 | * | congestion | |
| R2 | 1.1800/20 | * | congestion, May 2013 low | S3 | 1.1445 | * | Nov high | |
| R1 | 1.1690/00 | ** | 7 Jan YTD high, congestion | S4 | 1.1420/00 | ** | 17 Dec, Nov lows |
Asterisk denotes strength of level
07:45 GMT - Choppy trade from the 1.1690 high of last week see prices consolidating rally from the November low and unwinding the overbought intraday and daily studies. Break here will extend the underlying bull trend from the 2020 year low and see room to the 1.1800/20 congestion area and 1.1900, 50% Fibonacci level. Meanwhile, support at the 1.1600 congestion now underpin. Would take break here to fade the upside pressure and open up room for deeper correction to the 1.1500 congestion then the strong support at 1.1445/00 congestion and November low.