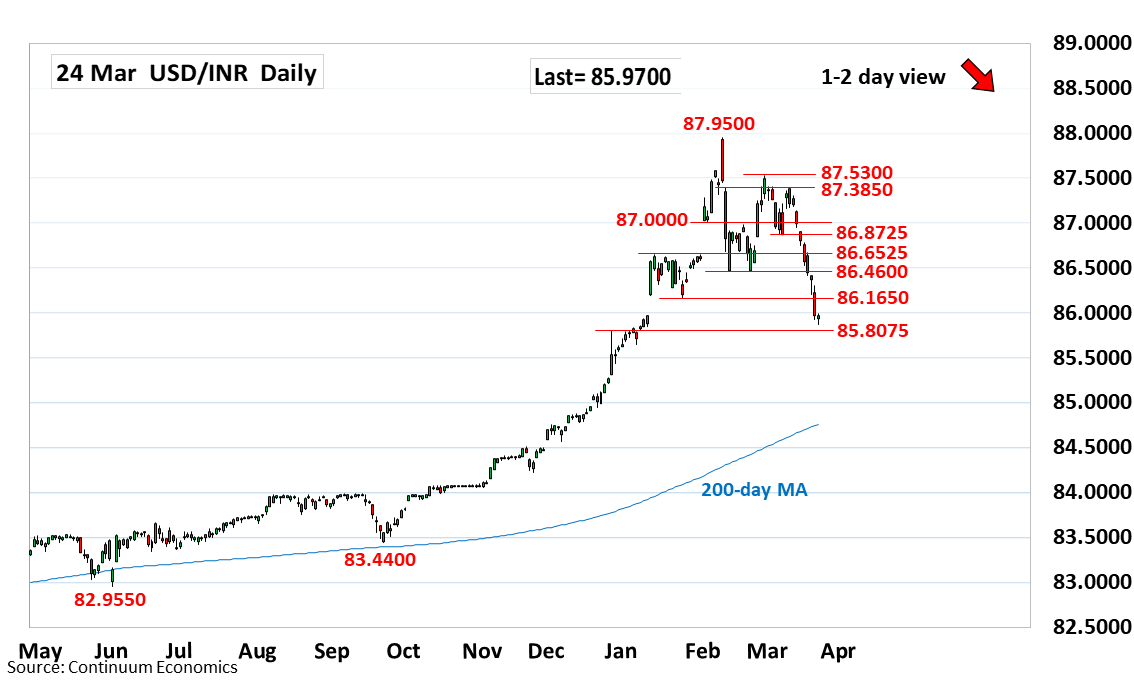
Prices remains under pressure to extend break of the February low at 86.4600 last week

| Level | Comment | Level | Comment | |||||
|---|---|---|---|---|---|---|---|---|
| R4 | 86.8725 | ** | 7 Mar low | S1 | 85.8075 | * | Dec high | |
| R3 | 86.6525 | * | Jan high | S2 | 85.7150 | * | 50% Sep/Feb rally | |
| R2 | 85.4600 | ** | Feb low | S3 | 85.6500 | ** | 7 Jan YTD low | |
| R1 | 86.1650 | * | 24 Jan low | S4 | 85.3100 | * | 27 Dec low |
Asterisk denotes strength of level
05:15 GMT - Prices remains under pressure to extend break of the February low at 86.4600 last week. Losses through here extend the broader losses from the 87.9500, 10 February all-time high to reach 85.8675 low. Lower will see room to support at 85.8075 high of December then the 85.7150, 50% Fibonacci level. Deep oversold daily studies suggest scope for corrective bounce but upside likely to prove limited. Resistance is lowered to the 86.1650, 24 Jan low. Above here, will see room for stronger bounce but this is expected to be capped below the 85.4600, February low.