Published: 2025-06-13T08:28:40.000Z
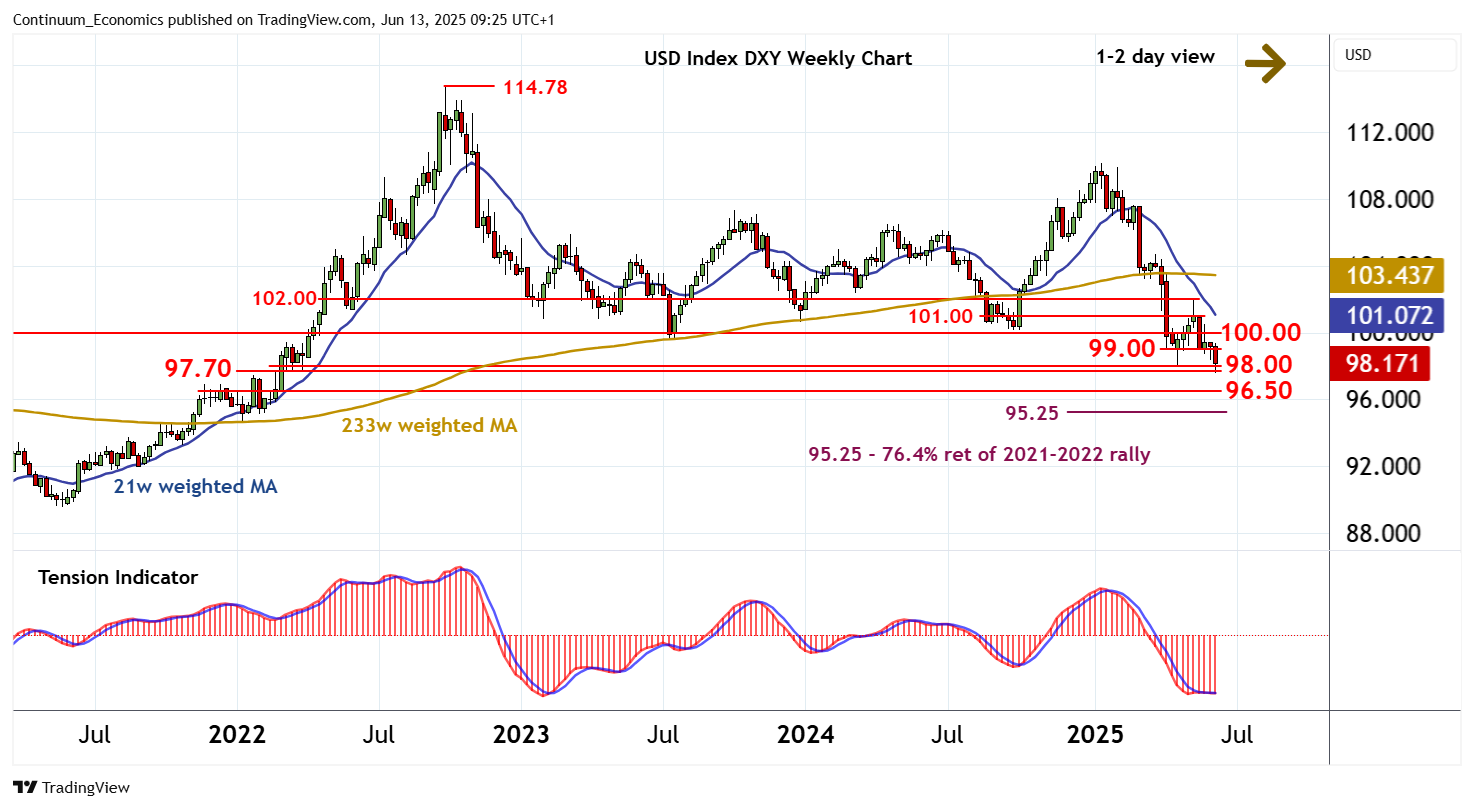
Chart USD Index DXY Update: Fresh 2025 year low

Senior Technical Strategist
2
The anticipated break below 98.00 has tested below the 97.70 weekly low of early-March 2022 to post a fresh 2025 year low at 97.60
| Levels | Imp | Comment | Levels | Imp | Comment | |||
|---|---|---|---|---|---|---|---|---|
| R4 | 100.55 | * | 29 May (w) high | S1 | 98.00 | * | congestion | |
| R3 | 100.00 | ** | congestion | S2 | 97.70 | * | early-Mar 22 (w) low | |
| R2 | 99.50 | congestion | S3 | 97.60 | * | 12 Jun YTD low | ||
| R1 | 99.00 | break level | S4 | 96.50 | * | congestion |
Asterisk denotes strength of level
09:05 BST - The anticipated break below 98.00 has tested below the 97.70 weekly low of early-March 2022 to post a fresh 2025 year low at 97.60, before bouncing back into choppy trade above 98.00. Rising intraday studies highlight potential for a test higher. But negative daily readings and mixed weekly charts are expected to limit scope in renewed selling interest towards 99.00. Following cautious/choppy trade, fresh losses are looked for. A later close below 97.70 will add weight to sentiment and confirm continuation of September 2022 losses, initially towards 96.50.