Published: 2024-12-17T09:35:40.000Z
Chartbook: Chart GBP/USD: Scope for further weakness

Senior Technical Strategist
1
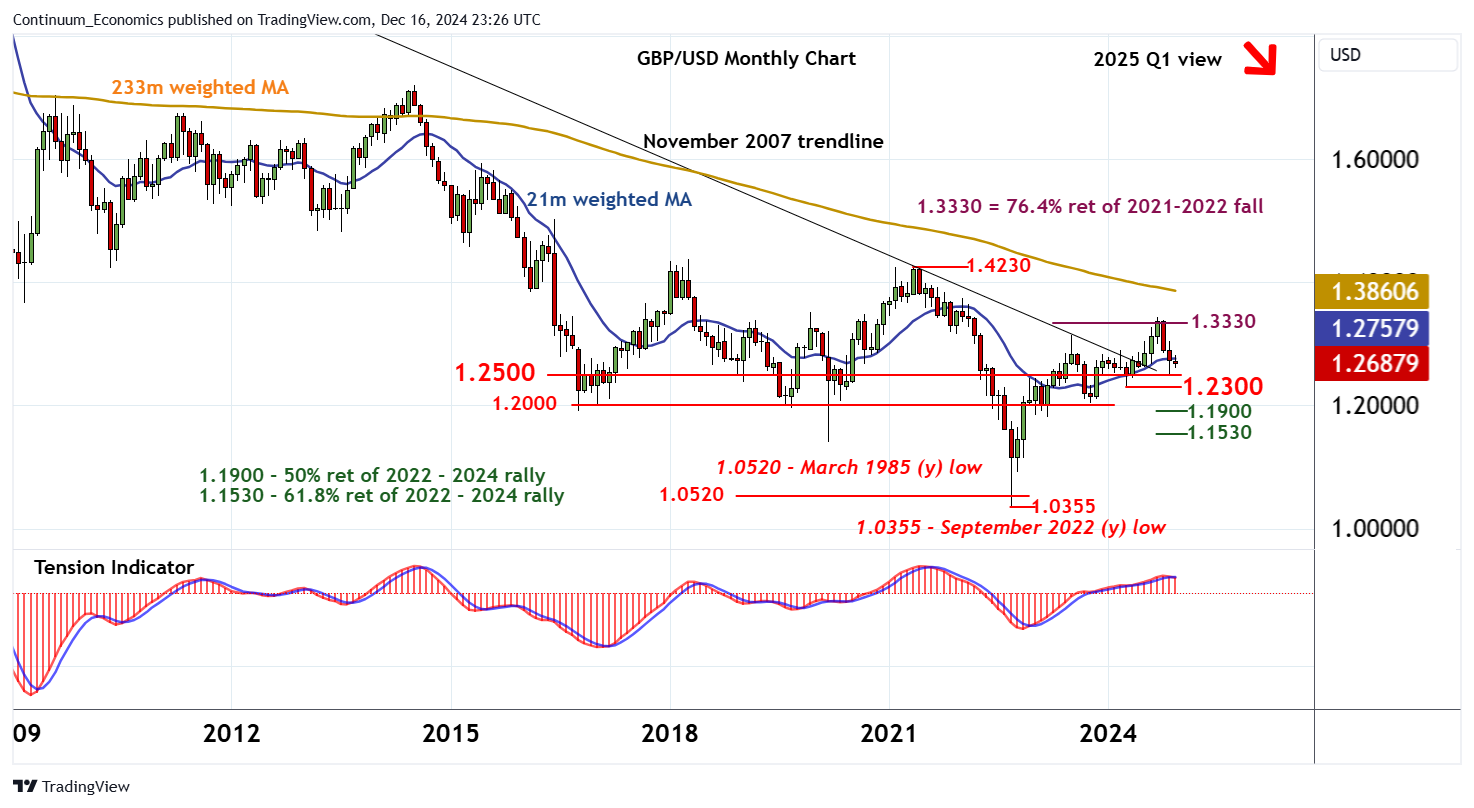
The anticipated break above critical resistance at the 1.3330 multi-month Fibonacci retracement has not been seen
The anticipated break above critical resistance at the 1.3330 multi-month Fibonacci retracement has not been seen,

as overbought monthly stochastics unwind, with steady selling interest reaching 1.2500.
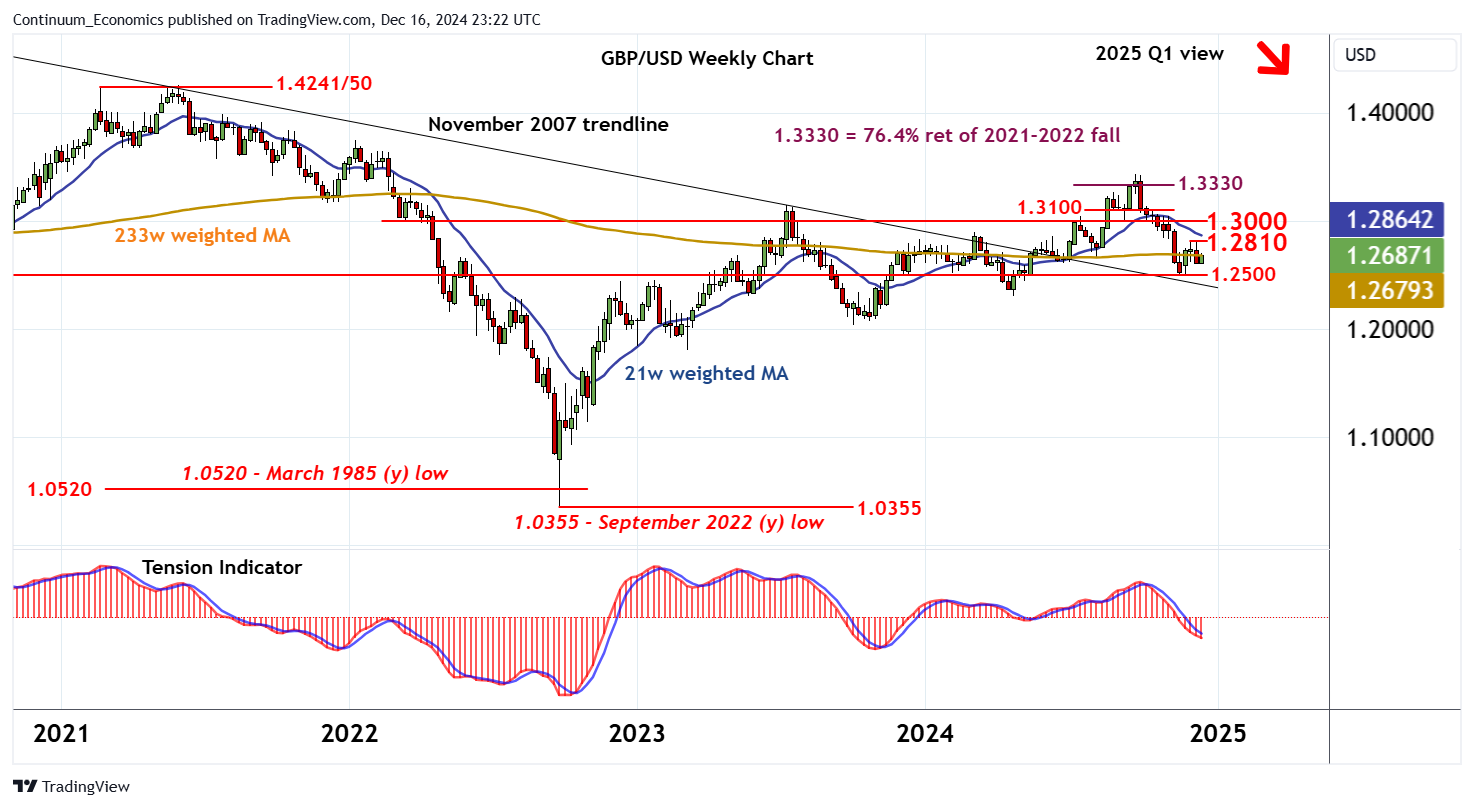
Just beneath here is the 1.2300 current year low of April, but oversold weekly studies could limit any immediate tests of this broad area in consolidation.
The monthly Tension Indicator is also turning down, but a close below 1.2300 is needed to turn sentiment outright negative and confirm a significant high in place around 1.3300, as September losses then target psychological support at 1.2000 and the 1.1900 Fibonacci retracement.
Meanwhile, resistance is at the 1.2810 weekly high of 6 December.

A break above here would open up stronger resistance at congestion around 1.3000. But a tick lower in oversold weekly stochastics is expected to limit any initial tests in fresh range trade.
A close above here, if seen, would help to improve sentiment and open up a retest of critical resistance at the 1.3330 retracement.