Published: 2025-05-19T02:08:56.000Z
Chart USD/SGD Update: Consolidating

Technical Analyst
-
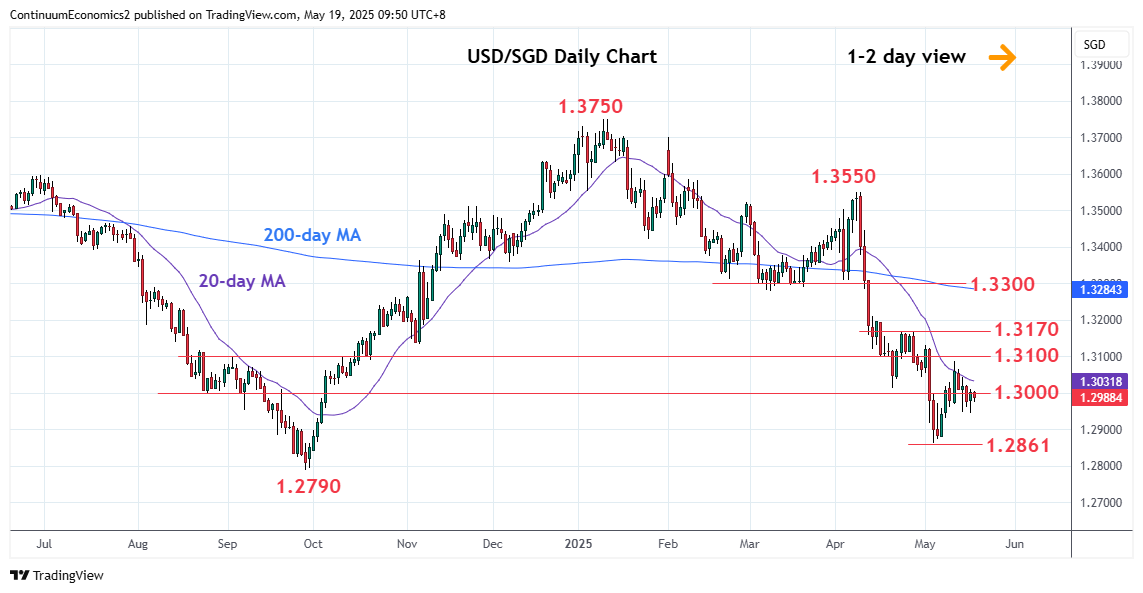
Little change, as prices extend consolidation above the 1.2950 congestion following rejection from the 1.3080, 38.2% Fibonacci level
| Level | Comment | Level | Comment | ||||
|---|---|---|---|---|---|---|---|
| R4 | 1.3170 | ** | 23 Apr high, 50% | S1 | 1.2950 | * | congestion |
| R3 | 1.3100/30 | * | congestion, 1 May high | S2 | 1.2900 | * | congestion |
| R2 | 1.3080 | * | 38.2% Apr/May fall | S3 | 1.2861 | ** | 5 May YTD low |
| R1 | 1.3000/10 | * | congestion, Apr low | S4 | 1.2790 | ** | Sep 2024 multi-year low |
Asterisk denotes strength of level
02:00 GMT - Little change, as prices extend consolidation above the 1.2950 congestion following rejection from the 1.3080, 38.2% Fibonacci level. Daily studies are mixed and suggest further ranging action at the 1.3000 level. Would take break of support at the 1.2950 congestion will open up room for retest of the 1.2900 level and 1.2861, 5th May current year low. Meanwhile, resistance remains at the 1.3000/10 congestion and April low. Break here will expose the 1.3080 Fibonacci level to retest and see room for stronger corrective bounce to retrace April/May losses.