Chart GBP/USD Update: Drifting lower
The anticipated test of congestion support at 1.3600 is giving way to consolidation
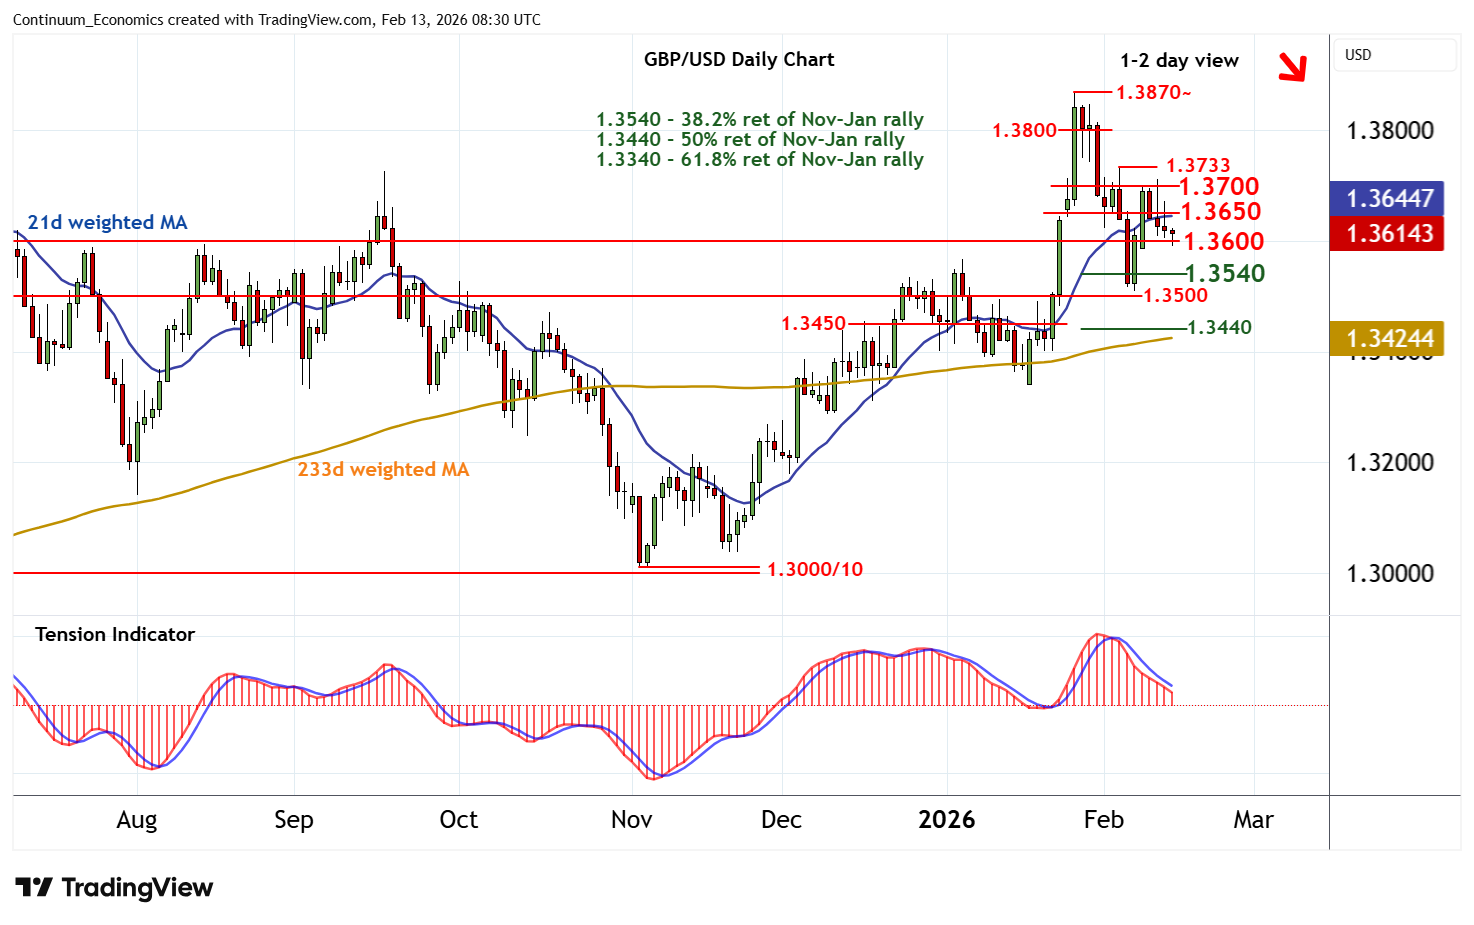
| Level | Comment | Level | Comment | |||||
|---|---|---|---|---|---|---|---|---|
| R4 | 1.3800 | * | congestion | S1 | 1.3600 | * | congestion | |
| R3 | 1.3733 | * | 4 Feb (w) high | S2 | 1.3540 | * | 38.2% ret of Nov-Jan rally | |
| R2 | 1.3700 | break level | S3 | 1.3500/10~ | ** | congestion; 6 Feb (w) low | ||
| R1 | 1.3650 | * | break level | S4 | 1.3440/50 | ** | 50% ret; congestion |
Asterisk denotes strength of level
08:10 GMT - The anticipated test of congestion support at 1.3600 is giving way to consolidation, as oversold intraday studies turn higher. Daily stochastics have ticked lower and the daily Tension Indicator is bearish, highlighting a deterioration in price action and room for further losses in the coming sessions. A break will open up the 1.3540 Fibonacci retracement. But mixed/positive weekly charts should limit any immediate further losses in consolidation above strong support at 1.3500/10. A close beneath here would turn sentiment negative and confirm continuation of late-January losses. Meanwhile, a close back above resistance at 1.3650 would help to stabilise price action and give way to consolidation beneath 1.3700.