Published: 2026-04-02T02:02:41.000Z
Chart GBP/USD Update: Lower in consolidation below 1.3300
1
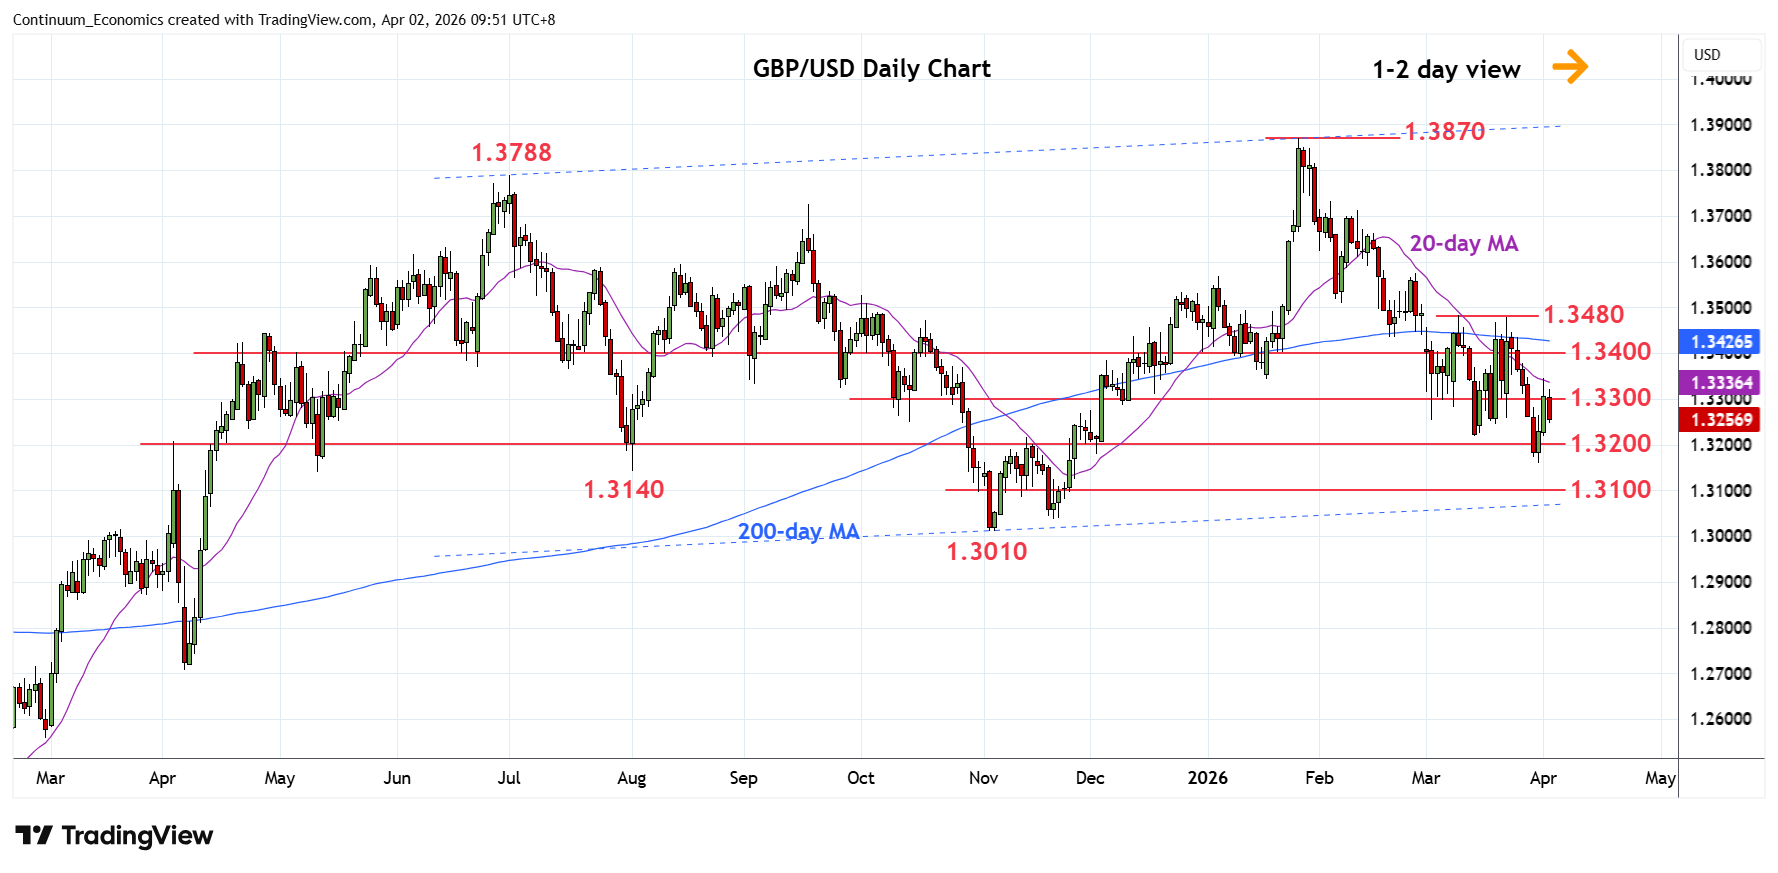
Limited above the 1.3300 level as prices settled back in range from the 1.3346, Wednesday's high
| Level | Comment | Level | Comment | |||||
|---|---|---|---|---|---|---|---|---|
| R4 | 1.3480 | ** | Mar highs | S1 | 1.3200 | * | congestion | |
| R3 | 1.3400 | ** | congestion | S2 | 1.3160 | ** | 31 Mar YTD low | |
| R2 | 1.3350 | * | congestion | S3 | 1.3140 | * | May, Aug lows | |
| R1 | 1.3300 | * | congestion | S4 | 1.3100 | * | congestion |
Asterisk denotes strength of level
02:00 GMT - Limited above the 1.3300 level as prices settled back in range from the 1.3346, Wednesday's high. Lower high here see pressure returning to the downside for retest of support at the 1.3220/00 area. Break here will expose the 1.3160 current year low to retest. Below this will see room to extend losses to the 1.3100 level then 1.3010, November low. Meanwhile, resistance at the 1.3300/1.3350 congestion area now expected to cap. Would need to clear this to ease the downside pressure and see scope for stronger bounce to retest resistance at 1.3480, March lower high.