Chartbook: Chart Shanghai Shenzhen CSI 300: Room to extend April gains
0
161
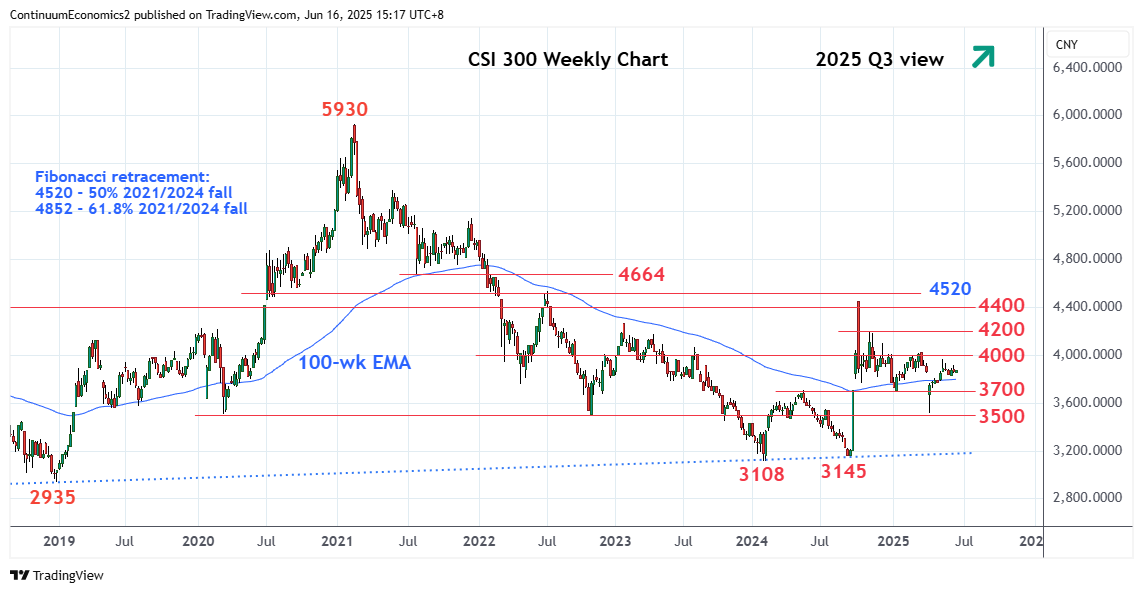
Volatile trade in Q2 has seen rebound from fresh year low 3514 to retrace almost all of the March/April losses to reach 3960 high
Volatile trade at the start of Q2 saw losses through 3700 support to reach fresh year low 3514. Rebound from there to regain the 3700 level see gains retracing almost all of the March/April losses to reach 3960 high.
Prices has since settled back in consolidation with pullback to see the 3700 level back as support and protecting the downside. Consolidation here is expected to give way to retest of the 3960 May high and where clearance will see room to retest the 4000 figure then the 4025, March YTD high. Clearance here will revive upside focus for retest of resistance at the 4200 level. Gains beyond this will return focus to the 4400 congestion then the 4450, October 2024 year high. Break of these will see room to 4520, 50% Fibonacci level.
Meanwhile, support at the 3700 low of January expected to underpin and limit corrective pullback. Only below here, but not expected, will expose the 3514, current April year low to retest.
4Cast Ltd. and all of its affiliates (Continuum Economics) do not conduct “investment research” as defined in the FCA Conduct of Business Sourcebook (COBS) section 12 nor do they provide “advice about securities” as defined in the Regulation of Investment Advisors by the U.S. SEC. Continuum Economics is not regulated by the SEC or by the FCA or by any other regulatory body. This research report has not been prepared in accordance with legal requirements designed to promote the independence of investment research and is not subject to any prohibition on dealing ahead of the dissemination of investment research. Nonetheless, Continuum Economics has an internal policy that prohibits “front-running” and that is designed to minimize the risk of receiving or misusing confidential or potentially material non-public information. The views and conclusions expressed here may be changed without notice. Continuum Economics, its partners and employees make no representation about the completeness or accuracy of the data, calculations, information or opinions contained in this report. This report may not be copied, redistributed or reproduced in part or whole without Continuum Economics’s express permission. Information contained in this report or relied upon in its construction may previously have been disclosed under a consulting agreement with one or more clients. The prices of securities referred to in the report may rise or fall and past performance and forecasts should not be treated as a reliable indicator of future performance or results. This report is not directed to you if Continuum Economics is barred from doing so in your jurisdiction. Nor is it an offer or solicitation to buy or sell securities or to enter into any investment transaction or use any investment service.
Analyst Declaration I,PakLai Ng, the Technical Analyst declare that the views expressed herein are mine and are clear, fair and not misleading at the time of publication. They have not been influenced by any relationship, either a personal relationship of mine or a relationship of the firm, to any entity described or referred to herein nor to any client of Continuum Economics nor has any inducement been received in relation to those views. I further declare that in the preparation and publication of this report I have at all times followed all relevant Continuum Economics compliance protocols including those reasonably seeking to prevent the receipt or misuse of material non-public information.