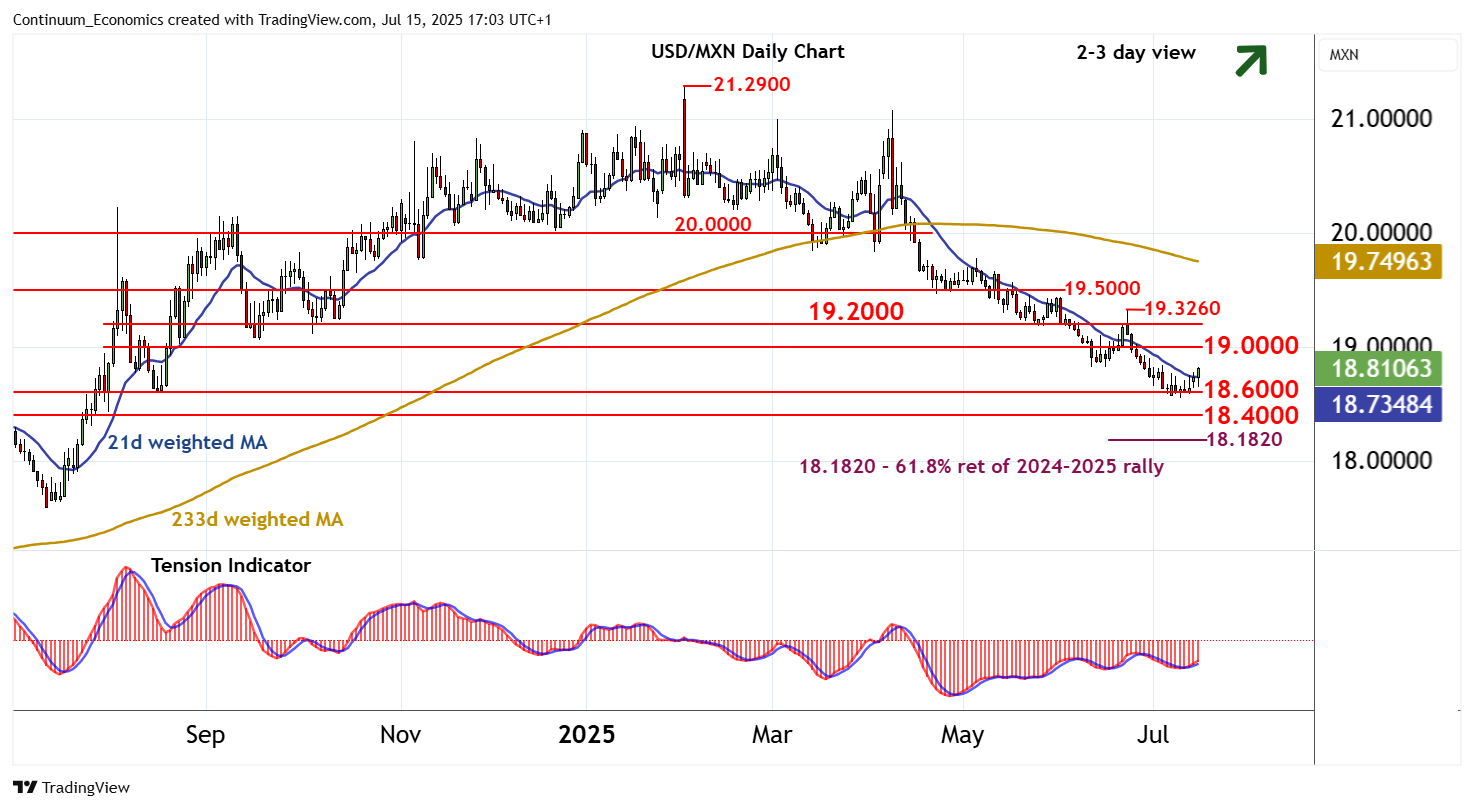
Chart USD/MXN Update: Corrective bounce from fresh year lows

The anticipated extension of February losses to support at 18.6000 has given way to a bounce
| Levels | Imp | Comment | Levels | Imp | Comment | |||
|---|---|---|---|---|---|---|---|---|
| R4 | 19.5000 | * | congestion | S1 | 18.6000 | ** | July-August 2024 break level | |
| R3 | 19.3260 | ** | 23 Jun (w) high | S2 | 18.4265 | 1 Aug 2024 (m) low | ||
| R2 | 19.2000 | * | congestion | S3 | 18.4000 | ** | congestion | |
| R1 | 19.0000 | * | congestion | S4 | 18.1820 | ** | 61.8% ret of 2024-2025 rally |
Asterisk denotes strength of level
16:45 BST - The anticipated extension of February losses to support at 18.6000 has given way to a bounce from fresh year lows, as oversold daily stochastics unwind and the daily Tension Indicator turns higher. Prices are currently trading around 18.8000, but weekly charts are also improving, suggesting room for continuation towards congestion resistance at 19.0000. Beyond here is 19.2000. But by-then overbought daily stochastics are expected to limit any initial tests of this range in consolidation. Meanwhile, a close below 18.6000, not yet seen, will add weight to sentiment and extend losses initially towards congestion around 18.4000.