Chart GBP/USD Update: Leaning lower
The anticipated test above 1.3600 has been pushed back from 1.3660
| Level | Comment | Level | Comment | |||||
|---|---|---|---|---|---|---|---|---|
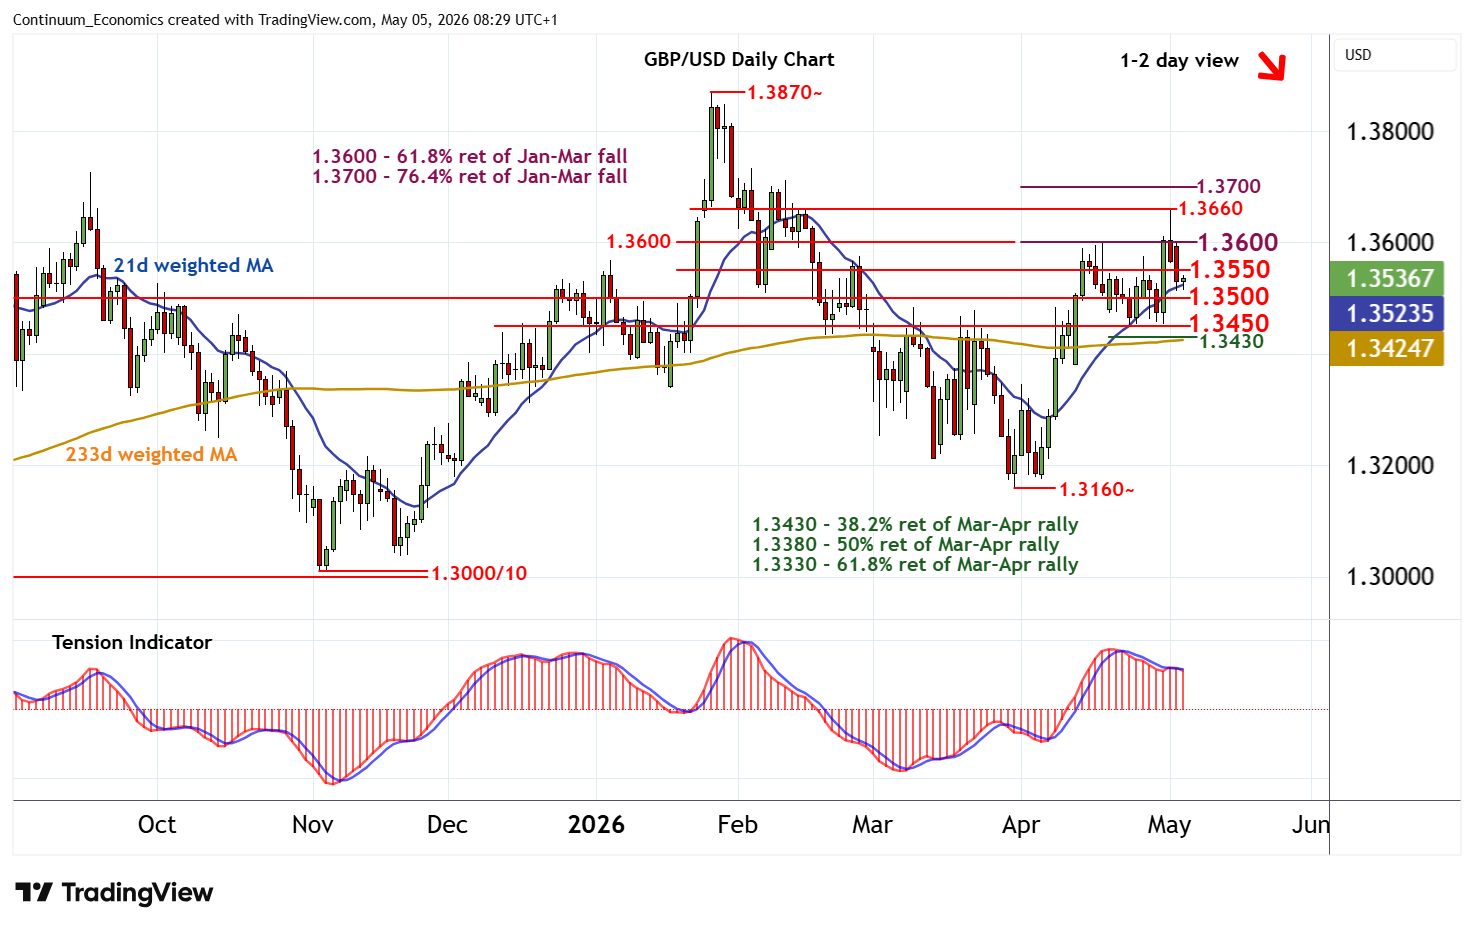
| R4 | 1.3700 | ** | 76.4% ret of Jan-Mar fall | S1 | 1.3500 | ** | congestion | |
| R3 | 1.3660 | * | congestion | S2 | 1.3450 | break level | ||
| R2 | 1.3600 | ** | congestion; 61.8% ret | S3 | 1.3430 | * | 38.2% ret of Mar-Apr rally | |
| R1 | 1.3550 | * | congestion | S4 | 1.3400 | * | congestion |
Asterisk denotes strength of level
08:10 BST - The anticipated test above 1.3600 has been pushed back from 1.3660, with steady losses currently balanced in cautious trade around 1.3535. Daily stochastics have turned lower and the daily Tension Indicator is also turning down, highlighting room for fresh losses in the coming sessions. Support is at congestion around 1.3500. A break will open up stronger support at 1.3450, where rising weekly charts could prompt fresh consolidation. A close beneath here, however, will add weight to sentiment and extend losses below the 1.3430 Fibonacci retracement towards congestion around 1.3400. Meanwhile, a close above 1.3600 will improve sentiment and prompt a retest of 1.3660..