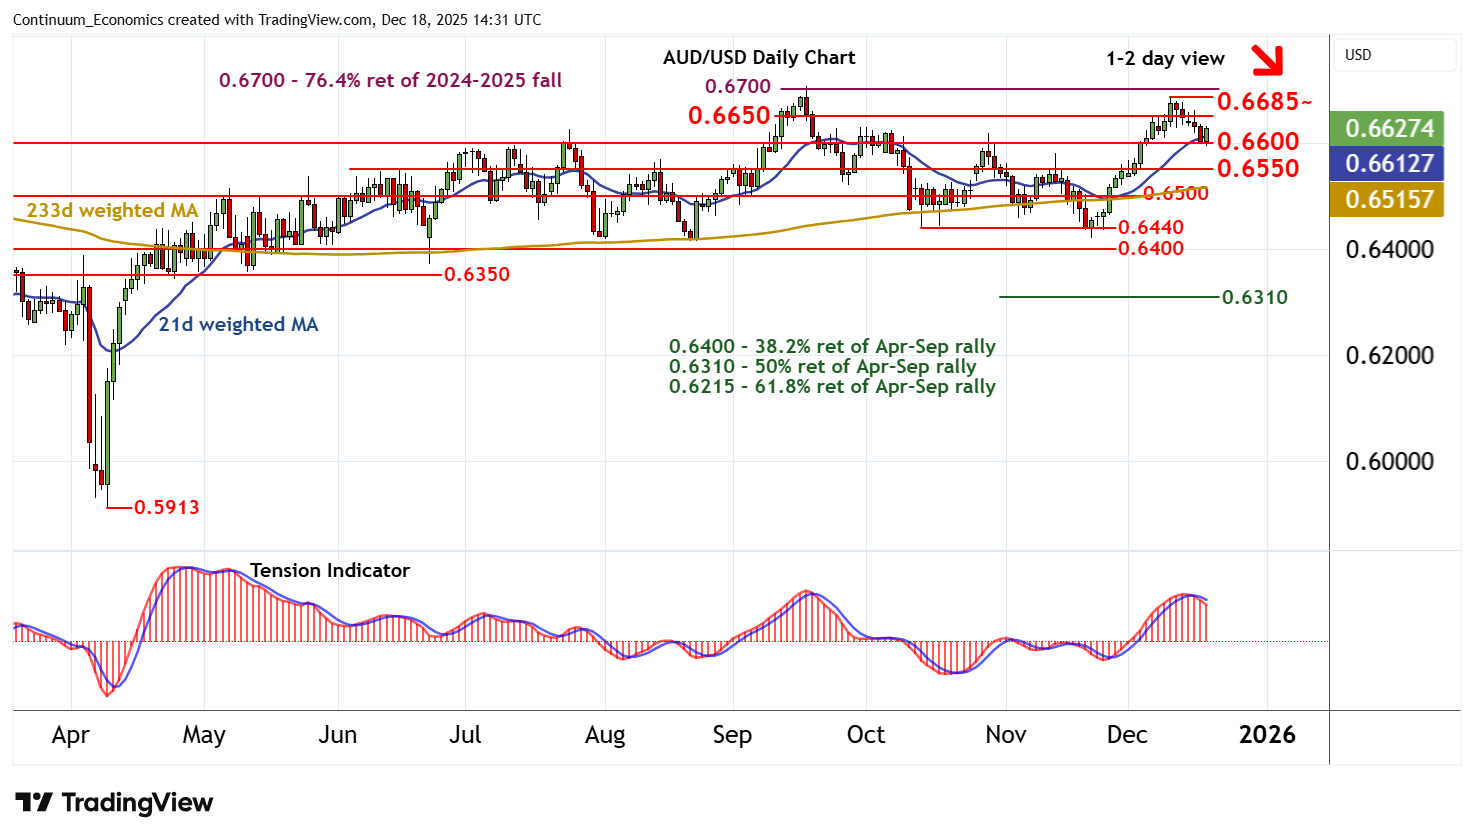
Chart AUD/USD Update: Leaning lower
The anticipated test of congestion support at 0.6600 is giving way to consolidation
| Levels | Imp | Comment | Levels | Imp | Comment | |||
|---|---|---|---|---|---|---|---|---|
| R4 | 0.6705 | ** | 17 Sep YTD high | S1 | 0.6600 | ** | congestion | |
| R3 | 0.6700 | ** | 76.4% ret of 2024-2025 fall | S2 | 0.6550 | * | congestion | |
| R2 | 0.6685 | * | 10 Dec (w) high | S3 | 0.6500 | * | congestion | |
| R1 | 0.6650 | congestion | S4 | 0.6440 | ** | 14 Oct (m) low |
Asterisk denotes strength of level
14:25 GMT - The anticipated test of congestion support at 0.6600 is giving way to consolidation, as intraday studies turn higher, with prices currently trading around 0.6625. Daily stochastics and the daily Tension Indicator continue to track lower, highlighting room for a later break. But rising weekly charts should limit any break in renewed buying interest towards further congestion around 0.6550. Following cautious/corrective trade, fresh gains are looked for. A break above critical resistance at the 0.6700 Fibonacci retracement and the 0.6705 current year high of 17 September will improve sentiment and open up a test of 0.6800.