Published: 2026-01-15T06:43:30.000Z
Chart AUD/JPY Update: Lower in consolidation
-
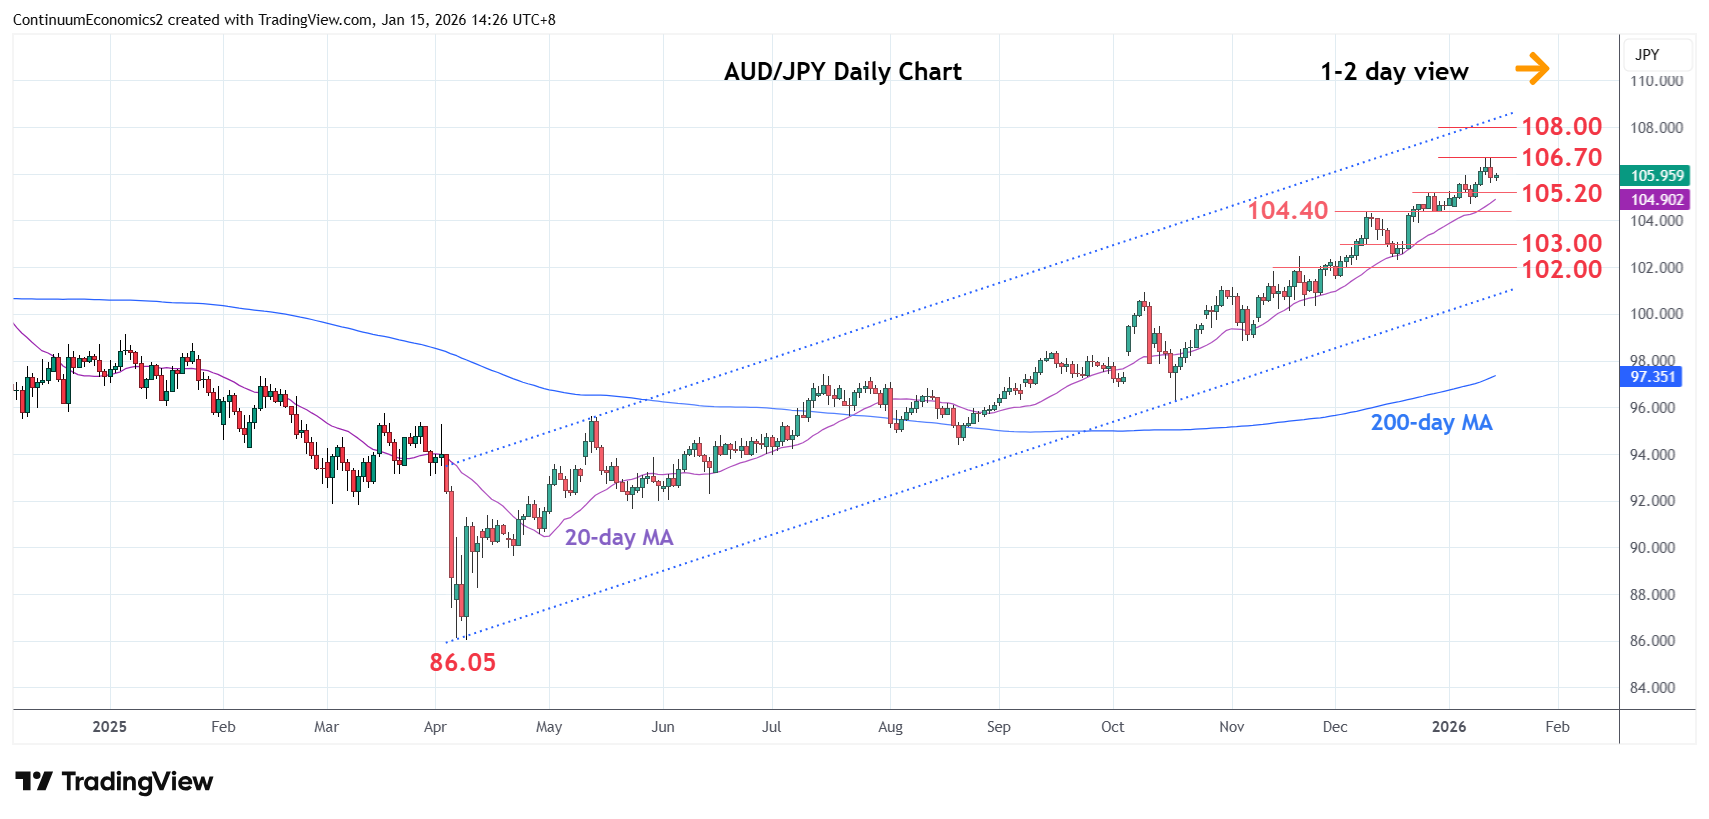
Limited on break above 106.00 level as prices gave way to selling pressure at the 106.70 high
| Levels | Imp | Comment | Levels | Imp | Comment | |||
|---|---|---|---|---|---|---|---|---|
| R4 | 110.00 | ** | figure | S1 | 105.20/00 | * | 29 Dec high, congestion | |
| R3 | 109.35 | ** | Jul 2024 year high | S2 | 104.40 | ** | 9 Dec high | |
| R2 | 108.00 | * | congestion | S3 | 104.00 | * | congestion | |
| R1 | 107.00 | * | congestion | S4 | 103.00 | * | congestion |
Asterisk denotes strength of level
06:30 GMT - Limited on break above 106.00 level as prices gave way to selling pressure at the 106.70 high to unwind the overbought intraday and daily studies. Below the 106.00 level open up room for deeper pullback to strong support at the 105.20/104.40, December highs. Break of the latter will see deeper pullback to retrace strong gains from the 96.25 October low to the 103.00/102.700 congestion. Would take break of the 106.70 high to see room for further extend the April gains to the 108.00 congestion and 109.35, July 2024 year high.