Published: 2025-08-21T00:45:47.000Z
Chart NZD/USD Update: Consolidating sharp losses
0
-
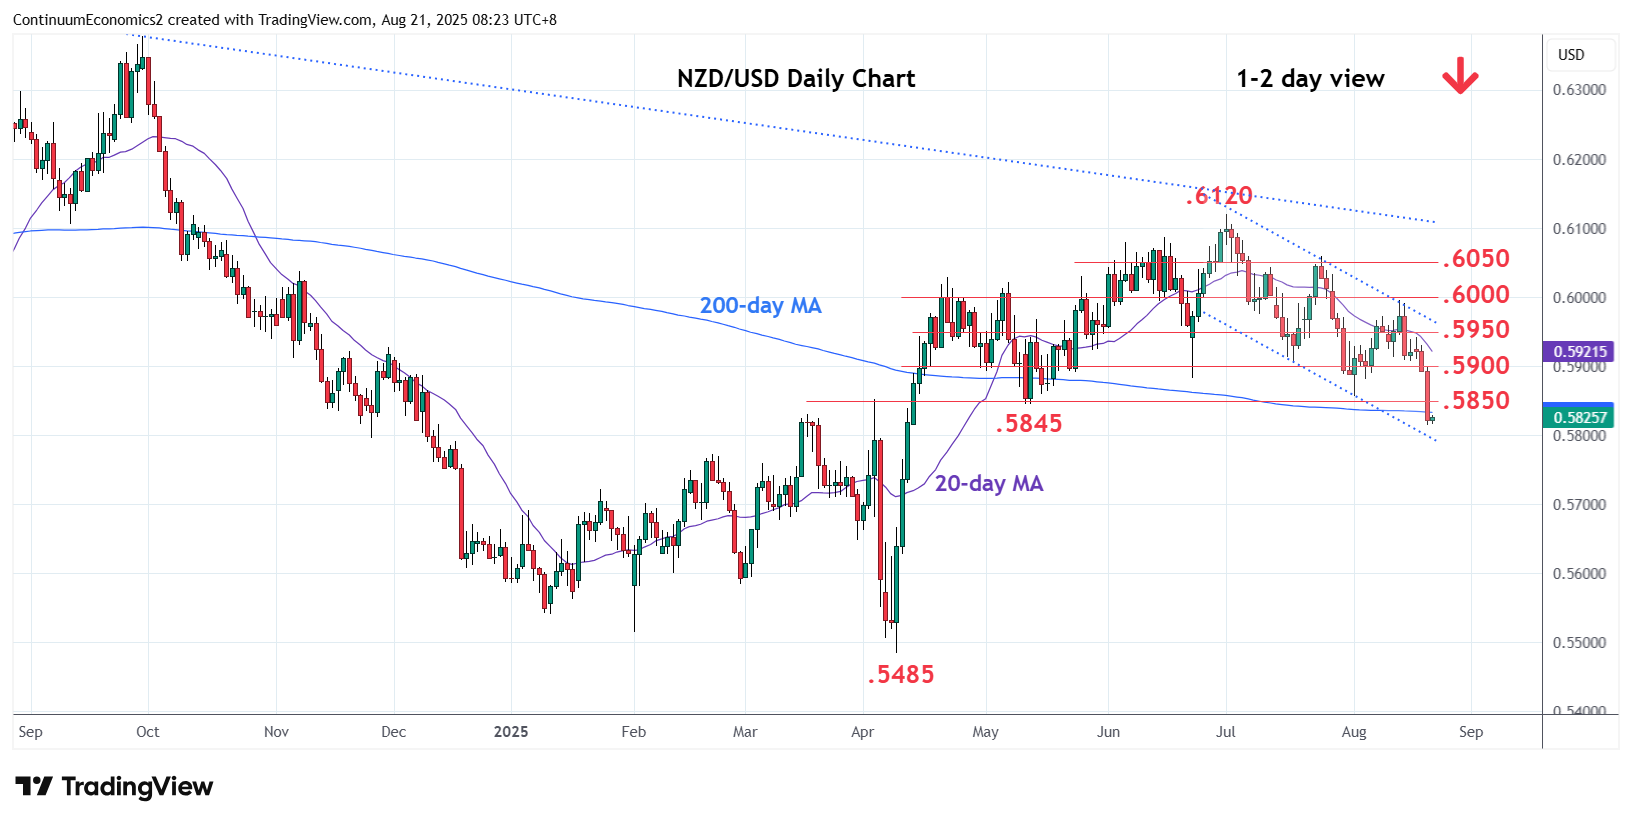
Break of the .5875 Fibonacci level has seen sharp losses to break strong support at the .5850/.5845
| Levels | Imp | Comment | Levels | Imp | Comment | |||
|---|---|---|---|---|---|---|---|---|
| R4 | .5995 | ** | 13 Aug high | S1 | .5800 | * | congestion, 50% | |
| R3 | .5950 | * | congestion | S2 | .5772 | * | Feb high | |
| R2 | .5900 | * | congestion | S3 | .5730 | * | 61.8% Apr/Jul rally | |
| R1 | .5850/55 | * | congestion, 1 Aug low | S4 | .5700 | * | congestion |
Asterisk denotes strength of level
00:35 GMT - Break of the .5875 Fibonacci level has seen sharp losses to break strong support at the .5850/.5845, congestion and May low. Prices has since stabilised at the .5815 low as prices unwind oversold intraday studies. Daily studies are stretched as well and caution corrective bounce. Nearby see support at the .5800 congestion and lower channel support from the July high. Meanwhile, resistance is lowered to the .5950/55 congestion area and 1 Aug low, now expected to cap. Break here will open up room for stronger bounce to .5900 level.