Chart USD/RUB Update: Extending losses
Anticipated losses are extending in broad USD-driven weakness, with the break below 79.0000 adding weight to sentiment
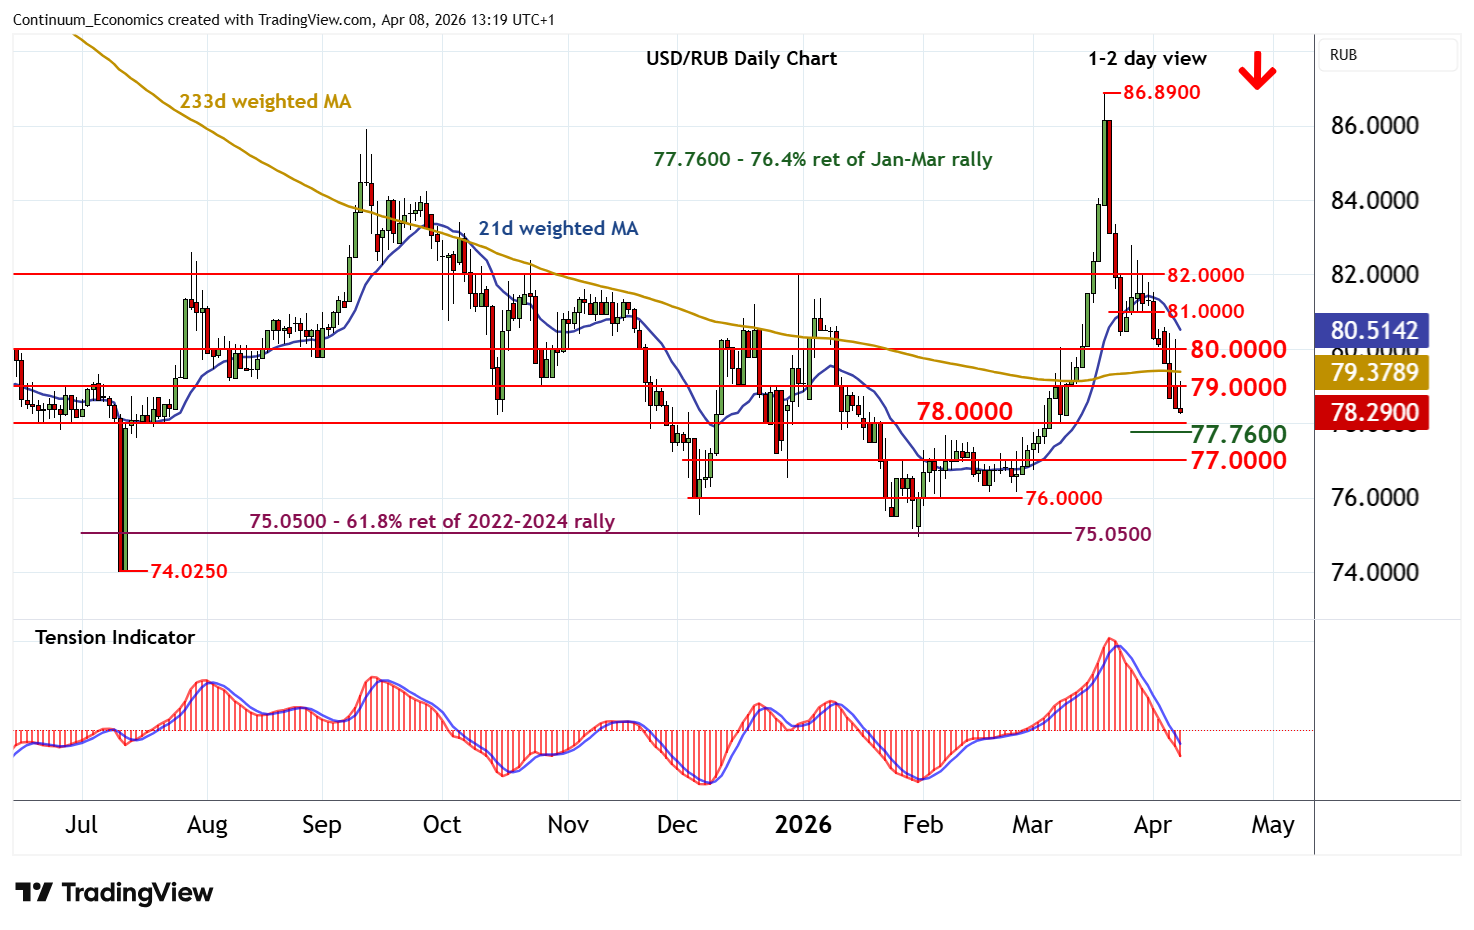
| Levels | Comment | Levels | Comment | |||||
| R4 | 82.0000 | ** | congestion | S1 | 78.0000 | * | congestion | |
| R3 | 81.0000 | * | congestion lows | S2 | 77.7600 | ** | 76.4% ret of Jan-Mar rally | |
| R2 | 80.0000 | * | break level | S3 | 77.0000 | ** | congestion | |
| R1 | 79.0000 | ** | congestion | S4 | 76.0000 | * | congestion |
Asterisk denotes strength of level
13:05 BST - Anticipated losses are extending in broad USD-driven weakness, with the break below 79.0000 adding weight to sentiment and putting focus on congestion around 78.0000. Just beneath here is the 77.7600 Fibonacci retracement. But flat oversold daily stochastics should limit any initial tests of this range in consolidation, before the bearish daily Tension Indicator and deteriorating weekly charts extend March losses towards further congestion around 77.0000. Meanwhile, resistance is lowered to congestion around 79.0000 and extends to 80.0000. This range should cap any immediate tests higher.