Published: 2026-01-19T08:14:56.000Z
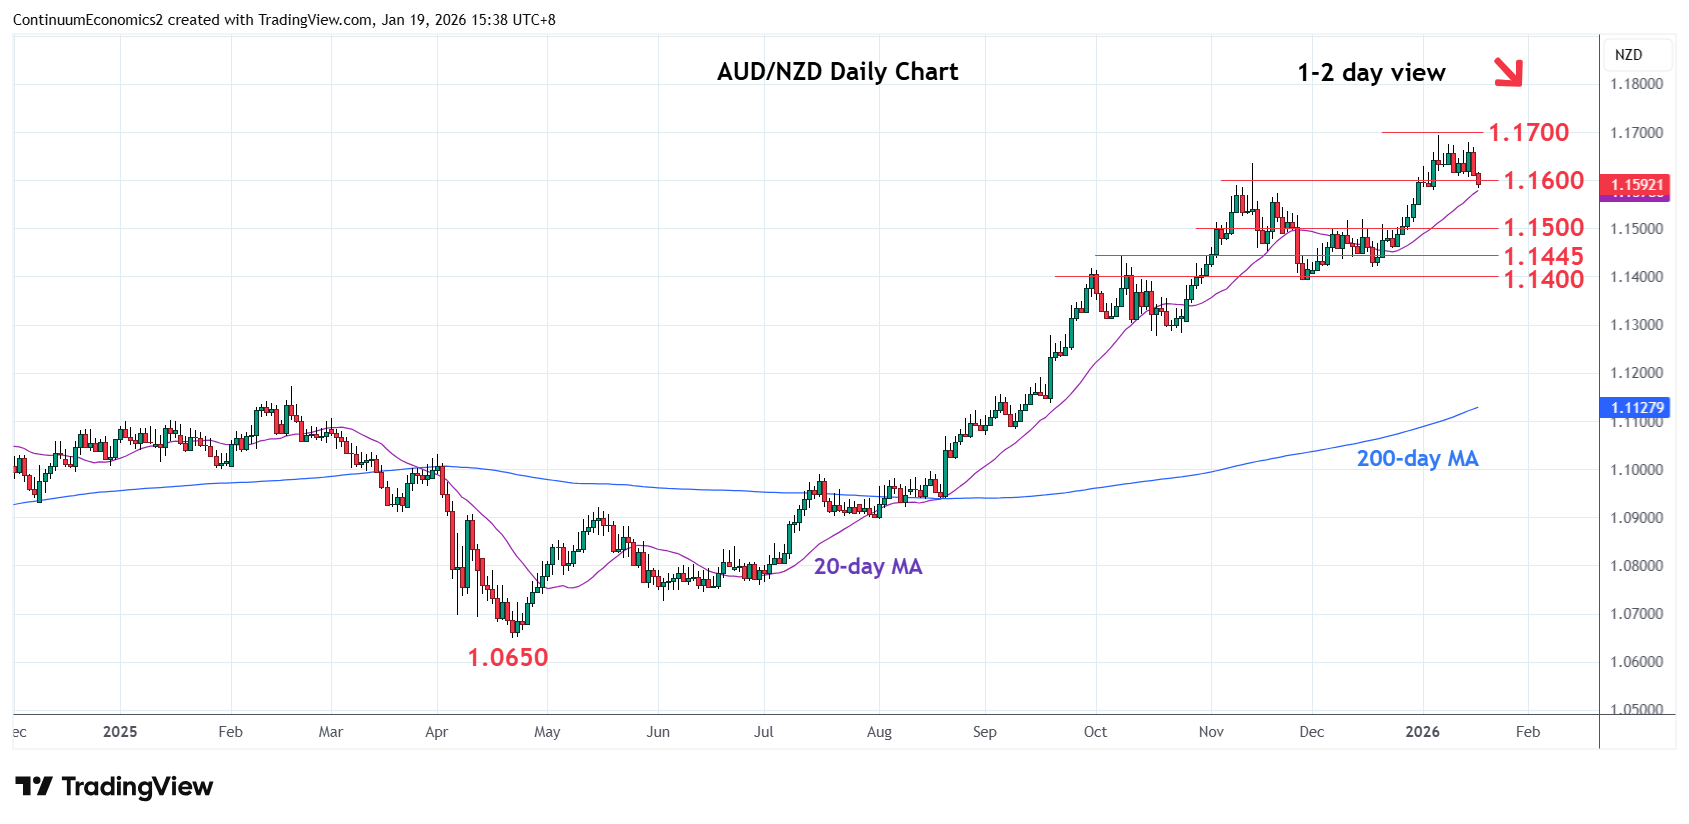
Chart AUD/NZD Update: Extending pullback from 1.1690 high
-
Consolidation below the 1.1690 high has given way to break of support at the 1.1600 level
| Level | Comment | Level | Comment | |||||
|---|---|---|---|---|---|---|---|---|
| R4 | 1.1900 | * | 50% 2011/2020 fall | S1 | 1.1550/00 | * | congestion | |
| R3 | 1.1800/20 | * | congestion, May 2013 low | S2 | 1.1445 | * | Nov high | |
| R2 | 1.1690/00 | ** | 7 Jan YTD high, congestion | S3 | 1.1420/00 | ** | 17 Dec, Nov lows | |
| R1 | 1.1635 | ** | Nov 2025 year high | S4 | 1.1300 | ** | congestion, 38.2% |
Asterisk denotes strength of level
08:00 GMT - Consolidation below the 1.1690 high has given way to break of support at the 1.1600 level as prices unwind overbought intraday and daily studies. Break here will open up room for deeper pullback to retrace gains from the 1.1400 November low. Lower will see for deeper correction to the 1.1550/00 congestion area which is expected to underpin. Would take break here to expose strong support at 1.1445/00 congestion and November low to retest. Meanwhile, resistance is lowered to 1.1635, November 2025 year high. Regaining this needed to expose the 1.1690 high to retest.