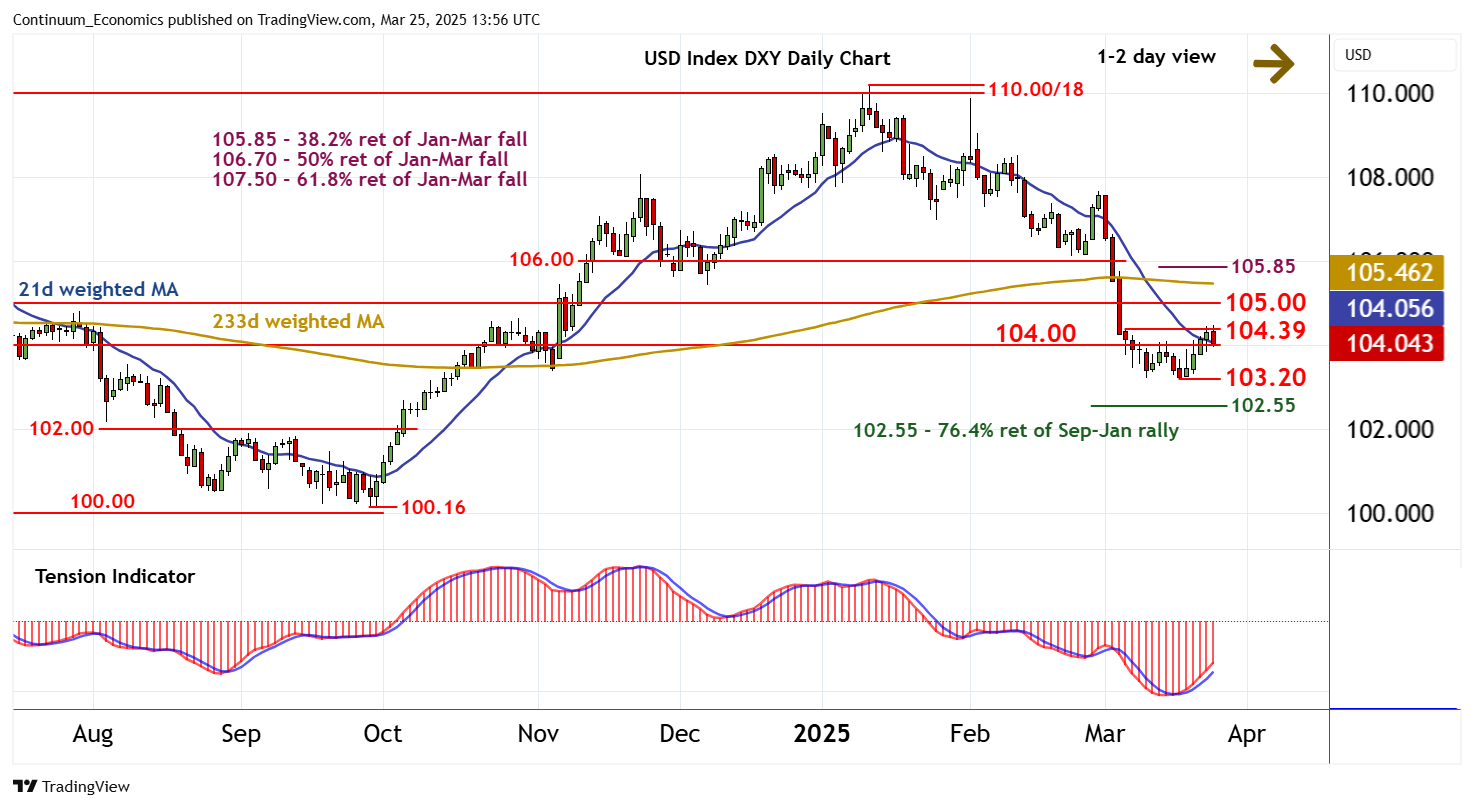
Chart USD Index DXY Update: Lower in range

Consolidation beneath resistance at the 104.39 high of 6 March is giving way to a pullback

| Levels | Imp | Comment | Levels | Imp | Comment | |||
|---|---|---|---|---|---|---|---|---|
| R4 | 106.00 | ** | break level | S1 | 104.00 | * | congestion | |
| R3 | 105.85 | ** | 38.2% ret of Jan-Mar fall | S2 | 103.20 | ** | 18 Mar YTD low | |
| R2 | 105.00 | break level | S3 | 103.00 | * | congestion | ||
| R1 | 104.39 | 6 Mar high | S4 | 102.55 | ** | 76.4% ret of Sep-Jan rally |
Asterisk denotes strength of level
13:40 GMT - Consolidation beneath resistance at the 104.39 high of 6 March is giving way to a pullback, as intraday studies turn down, with prices currently pressuring congestion support at 104.00. A break will add weight to sentiment and open up a test of the 103.20 current year low of 18 March, where rising daily readings and oversold weekly stochastics could prompt fresh consolidation. The negative weekly Tension Indicator and bearish monthly charts highlight a later break and extension of January losses below 103.00 towards the 102.55 Fibonacci retracement. Meanwhile, a close above 104.39 would turn sentiment cautiously positive and open up 105.00, where renewed selling interest is expected to appear.