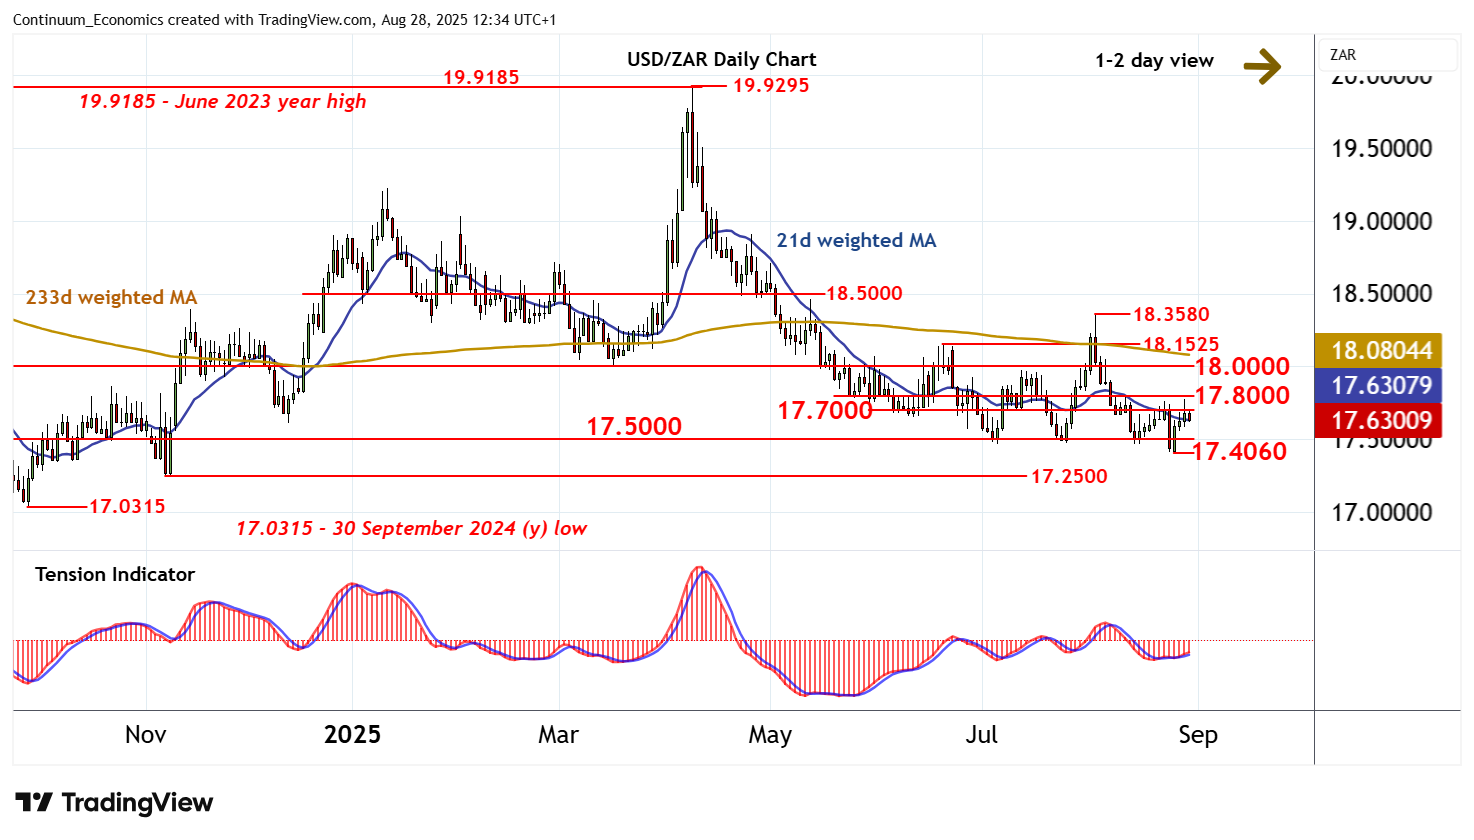
Chart USD/ZAR Update: Back in range - studies turning down
The test of congestion resistance within 17.7000-17.8000 has met selling interest around 17.7785
| Level | Comment | Level | Comment | |||||
|---|---|---|---|---|---|---|---|---|
| R4 | 18.1525 | ** | 19 Jun (m) high | S1 | 17.5000 | ** | congestion | |
| R3 | 18.0000 | ** | congestion | S2 | 17.4060 | ** | 25 Aug YTD low | |
| R2 | 17.8000 | * | congestion | S3 | 17.2500 | ** | 7 Nov (m) low | |
| R1 | 17.7000 | * | congestion | S4 | 17.0315 | ** | 30 Sep 2024 (y) low |
Asterisk denotes strength of level
12:10 BST - The test of congestion resistance within 17.7000-17.8000 has met selling interest around 17.7785, as intraday studies turn down, with prices currently trading around 17.6300. Overbought daily stochastics are also flattening, suggesting room for a pullback towards congestion support at 17.5000. But the positive daily Tension Indicator is expected to limit any initial tests in consolidation, before mixed/negative weekly charts and bearish longer-term readings prompt further losses. A close below the 17.4060 current year low of 25 August is needed to turn sentiment outright negative and extend April losses towards the 17.0315 year low of 30 September 2024. Meanwhile, a close above congestion resistance at 17.8000, if seen, will turn sentiment positive and open up 18.0000.