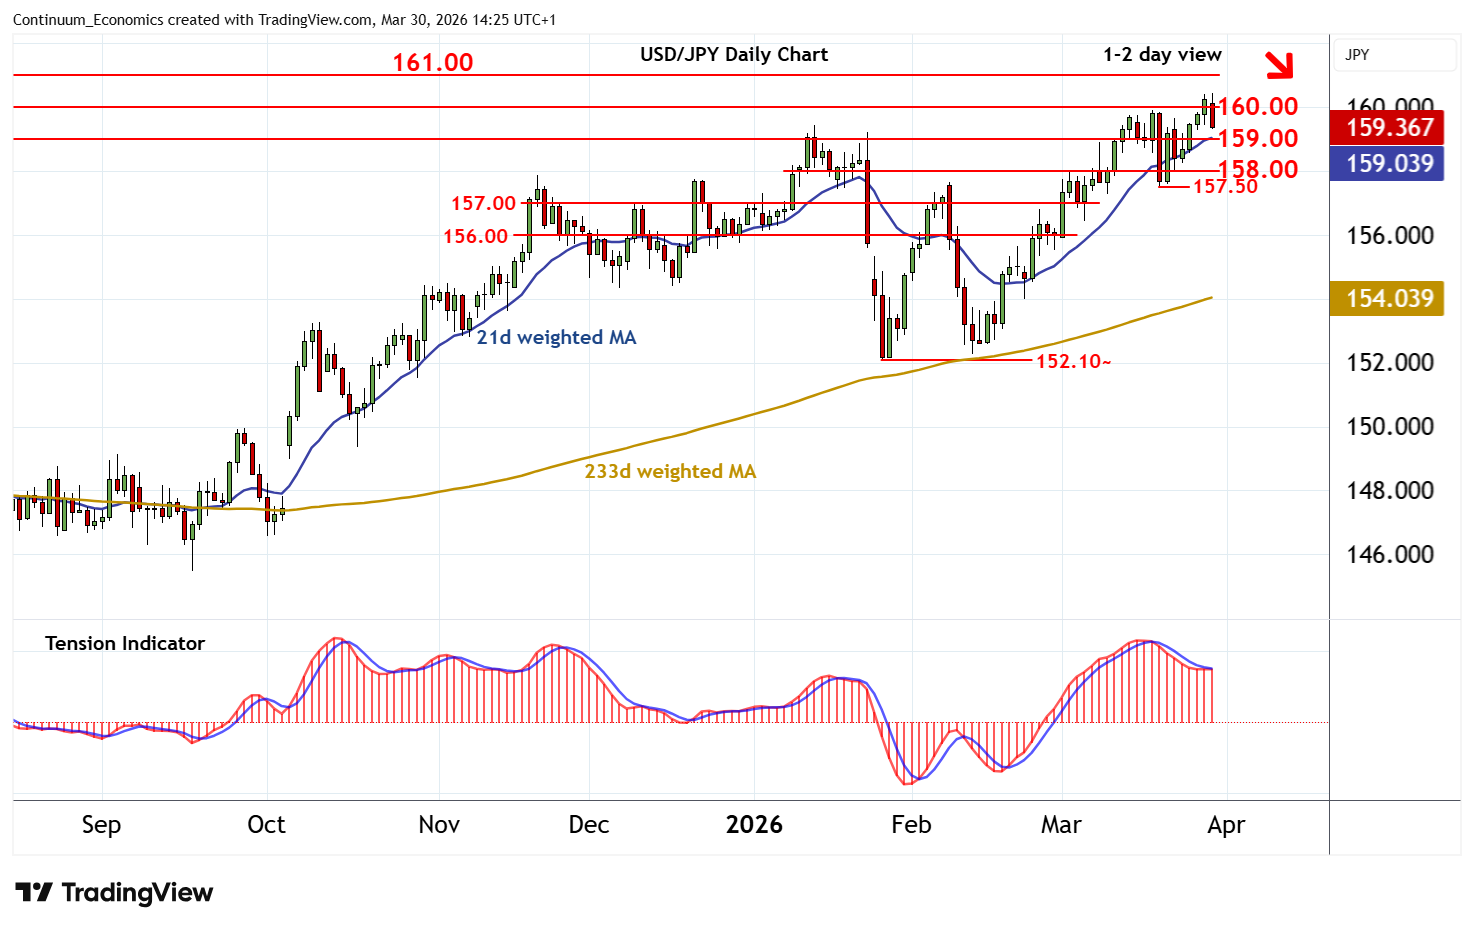
Chart USD/JPY Update: Turning away from fresh year high in JPY-driven trade
The anticipated break above historic congestion around 160.00 has posted a fresh year high around 160.45
| Levels | Imp | Comment | Levels | Imp | Comment | |||
|---|---|---|---|---|---|---|---|---|
| R4 | 161.95 | ** | July 2024 (y) high | S1 | 159.00 | * | congestion | |
| R3 | 161.00 | July 2024 congestion | S2 | 158.00 | * | break level | ||
| R2 | 160.45 | ** | fresh YTD high | S3 | 157.50 | * | 19 Mar (w) low | |
| R1 | 160.00 | ** | historic congestion | S4 | 157.00 | congestion |
Asterisk denotes strength of level
14:05 BST - The anticipated break above historic congestion around 160.00 has posted a fresh year high around 160.45, before falling steadily in JPY-driven trade to currently trade around 159.35. Daily readings have turned mixed/negative and positive weekly stochastics are flattening, suggesting room for a test of congestion support at 159.00. But the rising weekly Tension Indicator and positive longer-term charts should limit any immediate break beneath here in consolidation above support at 158.00. Meanwhile, a close back above 160.45 will improve price action and extend September 2024 gains beyond 160.45 towards July 2024 congestion around 161.00.