Published: 2026-01-20T08:31:17.000Z
Chart USD Index DXY Update: Under pressure
-
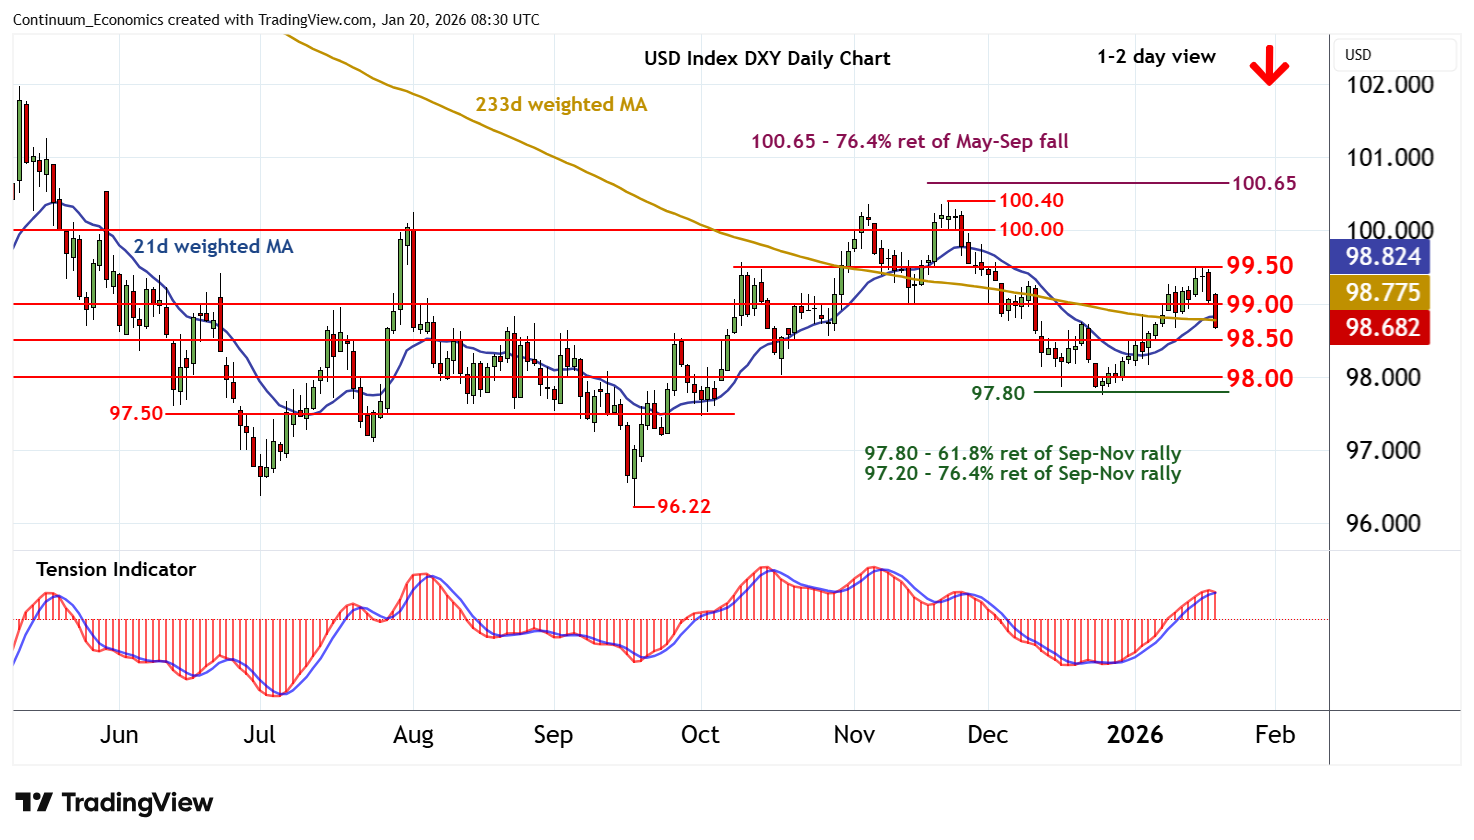
Cautious trade above 99.00 has given way to the anticipated break
| Levels | Imp | Comment | Levels | Imp | Comment | |||
|---|---|---|---|---|---|---|---|---|
| R4 | 100.40 | ** | 21 Nov (m) high | S1 | 98.50 | * | congestion | |
| R3 | 100.00 | ** | congestion | S2 | 98.00 | * | congestion | |
| R2 | 99.50 | * | break level | S3 | 97.80 | ** | 61.8% ret of Sep-Nov rally | |
| R1 | 99.00 | * | congestion | S4 | 97.50 | ** | congestion |
Asterisk denotes strength of level
08:15 GMT - Cautious trade above 99.00 has given way to the anticipated break, as intraday studies turn down, with prices currently trading around 98.65. Overbought daily stochastics are unwinding and the positive daily Tension Indicator is turning down, putting focus on congestion support at 98.50. Continuation beneath here will open up congestion around 98.00 and the 97.80 Fibonacci retracement. But mixed weekly charts should limit any break below 98.00 in consolidation above here. Meanwhile, a close back above congestion resistance at 99.00 would help to stabilise price action and give way to consolidation beneath 99.50.