Chart USD/CAD Update: Consolidating - studies improving
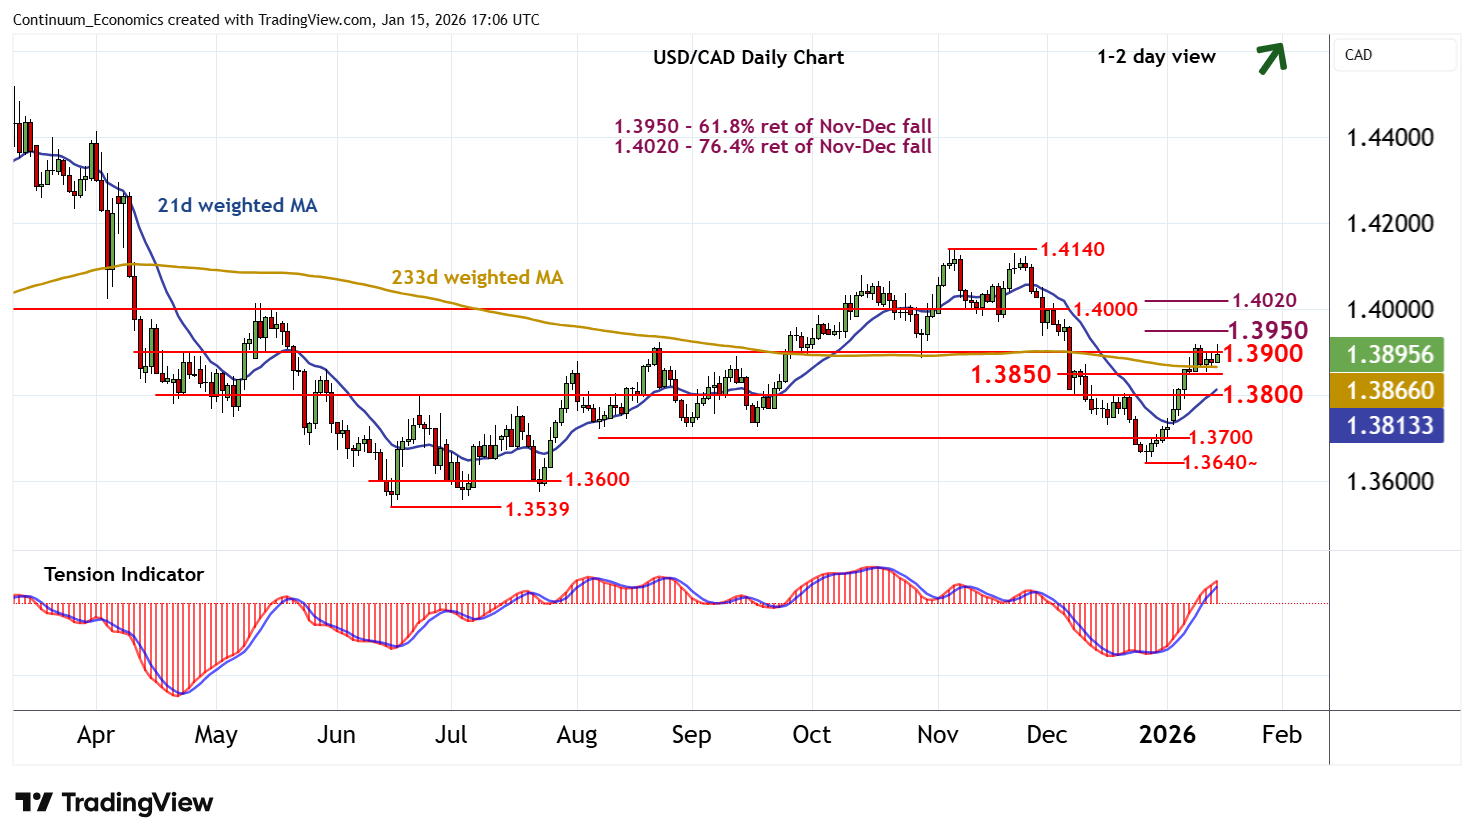
Cautious trade has given way to a test of resistance at 1.3900/20
| Levels | Imp | Comment | Levels | Imp | Comment | |||
|---|---|---|---|---|---|---|---|---|
| R4 | 1.4020 | ** | 76.4% ret of Nov-Dec fall | S1 | 1.3850 | congestion | ||
| R3 | 1.4000 | ** | congestion | S2 | 1.3800 | ** | congestion | |
| R2 | 1.3950 | ** | 61.8% ret of Nov-Dec fall | S3 | 1.3700 | * | congestion | |
| R1 | 1.3900/20 | ** | break level; 9 Jan (w) high | S4 | 1.3640 | * | 26 Dec (w) low |
Asterisk denotes strength of level
16:45 GMT - Cautious trade has given way to a test of resistance at 1.3900/20, where unwinding overbought intraday studies are prompting fresh reactions. The daily Tension Indicator continues to rise and overbought daily stochastics have ticked higher once again, highlighting room for further strength in the coming sessions. A break abve here will open up the 1.3950 Fibonacci retracement. Rising weekly charts highlight room for continuation towards the 1.4000/20 range, where profit-taking interest could increase. Meanwhile, support remains at congestion around 1.3850. A close beneath here, if seen, will turn sentiment neutral and prompt consolidation above 1.3800.