Published: 2026-02-09T11:56:41.000Z
Chart USD/CHF Update: Leaning lower
1
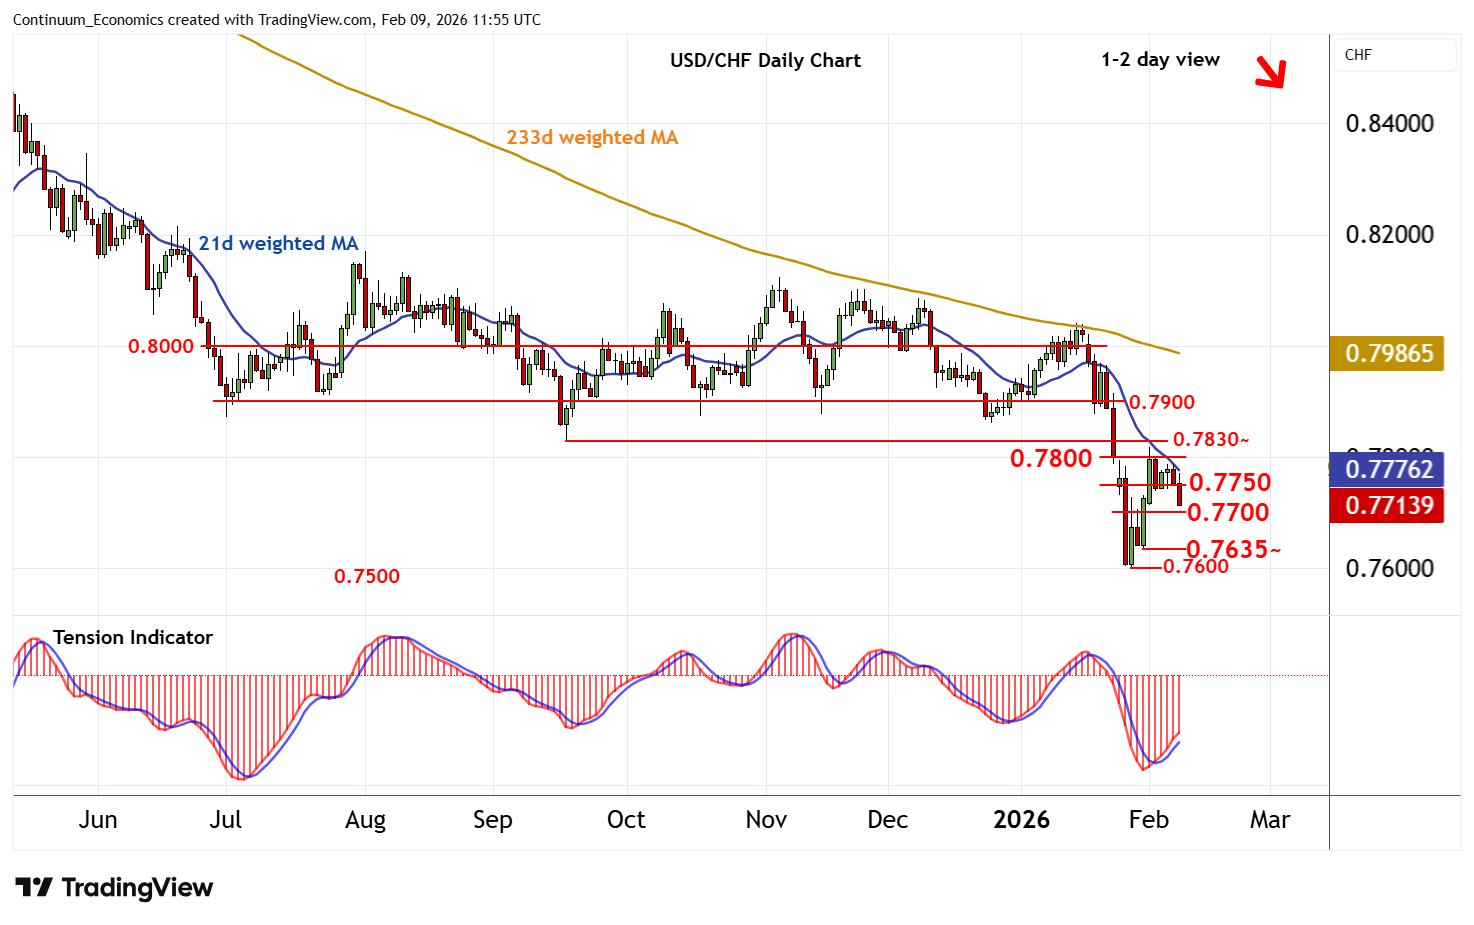
Consolidation within the 0.7750 - 0.7800 range has given way to a break lower
| Level | Comment | Level | Comment | |||||
|---|---|---|---|---|---|---|---|---|
| R4 | 0.8000 | ** | congestion | S1 | 0.7700 | * | break level | |
| R3 | 0.7900 | * | congestion | S2 | 0.7635~ | 30 Jan low | ||
| R2 | 0.7830~ | * | 17 Sep 2025 (y) low | S3 | 0.7600 | ** | 28 Jan YTD low | |
| R1 | 0.7800 | * | break level | S4 | 0.7500 | * | figure |
Asterisk denotes strength of level
11:30 GMT - Consolidation within the 0.7750 - 0.7800 range has given way to a break lower, with prices approaching support at 0.7700. Intraday studies are negative, highlighting room for a test beneath here. But rising daily readings are expected to limit initial scope in consolidation above the 0.7635~ low of 30 January, before negative weekly charts prompt further losses. A close below critical support at the 0.7600 current year low of 28 January will turn sentiment negative and extend December 2016 losses initially to 0.7500. Meanwhile, resistance within 0.7750/00 should cap any immediate tests higher.