Published: 2024-12-19T11:55:07.000Z
Chart AUD/USD Update: Consolidating above fresh 2024 low - studies under pressure

Senior Technical Strategist
-

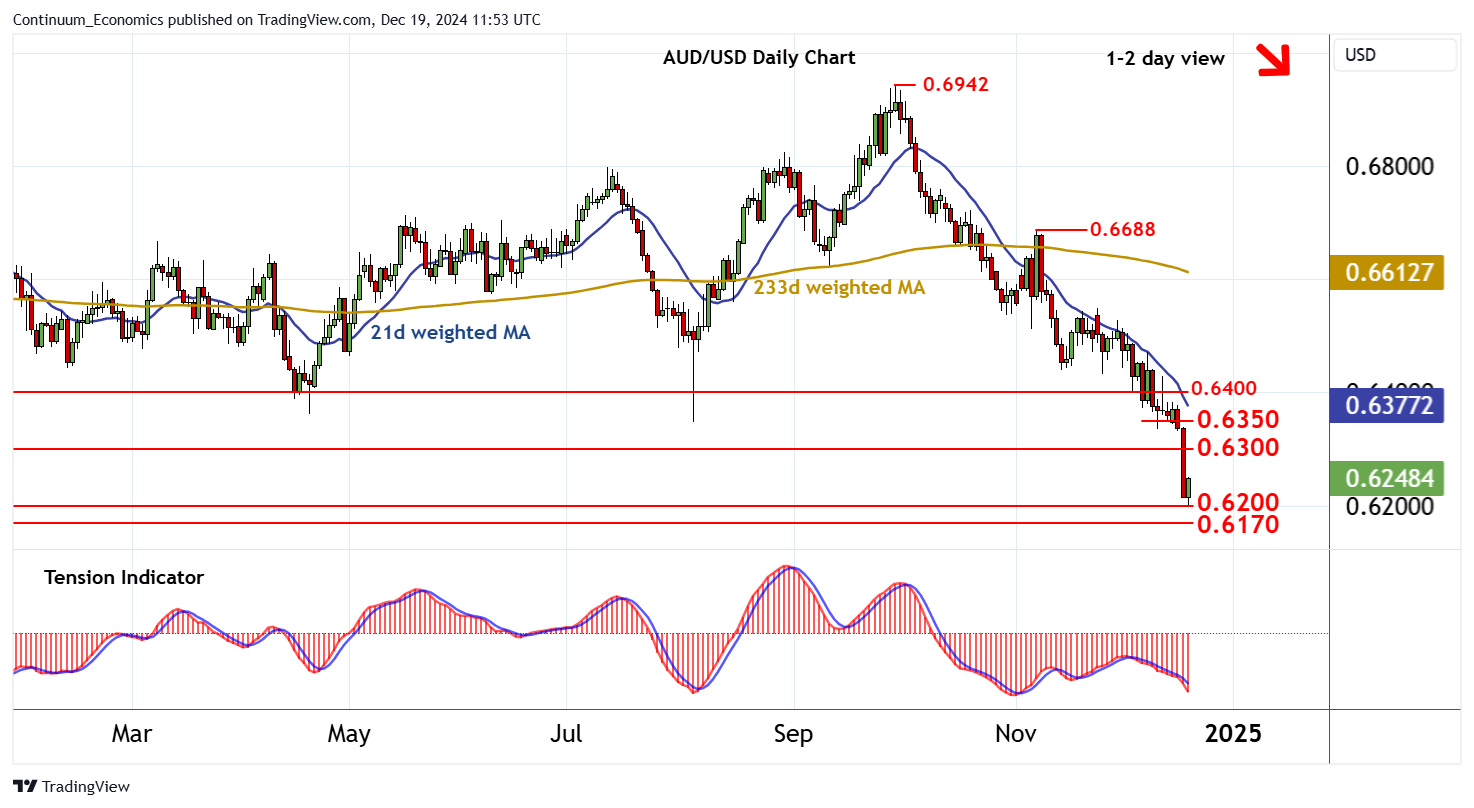
Anticipated losses have extended in sharp selling interest to post a fresh 2024 year low at 0.6200

| Levels | Imp | Comment | Levels | Imp | Comment | |||
|---|---|---|---|---|---|---|---|---|
| R4 | 0.6450 | break level | S1 | 0.6200 | ** | congestion | ||
| R3 | 0.6400 | * | congestion | S2 | 0.6170 | ** | October 2022 (y) low | |
| R2 | 0.6350 | break level | S3 | 0.6100 | ** | 76.4% ret of 2020-2021 rally | ||
| R1 | 0.6300 | ** | congestion | S4 | 0.6000 | ** | figure |
Asterisk denotes strength of level
11:45 GMT - Anticipated losses have extended in sharp selling interest to post a fresh 2024 year low at 0.6200. A minor bounce is appearing, as oversold intraday studies unwind. But negative daily and weekly readings are expected to limit scope in renewed selling interest beneath congestion resistance at 0.6300. Following cautious trade, fresh losses are looked for. A later break below 0.6200 will open up the 0.6170 year low of October 2022. with further selling interest extending January 2023 losses towards the 0.6100 Fibonacci retracement