Published: 2025-05-21T02:16:47.000Z
Chart USD/SGD Update: Under pressure

Technical Analyst
-
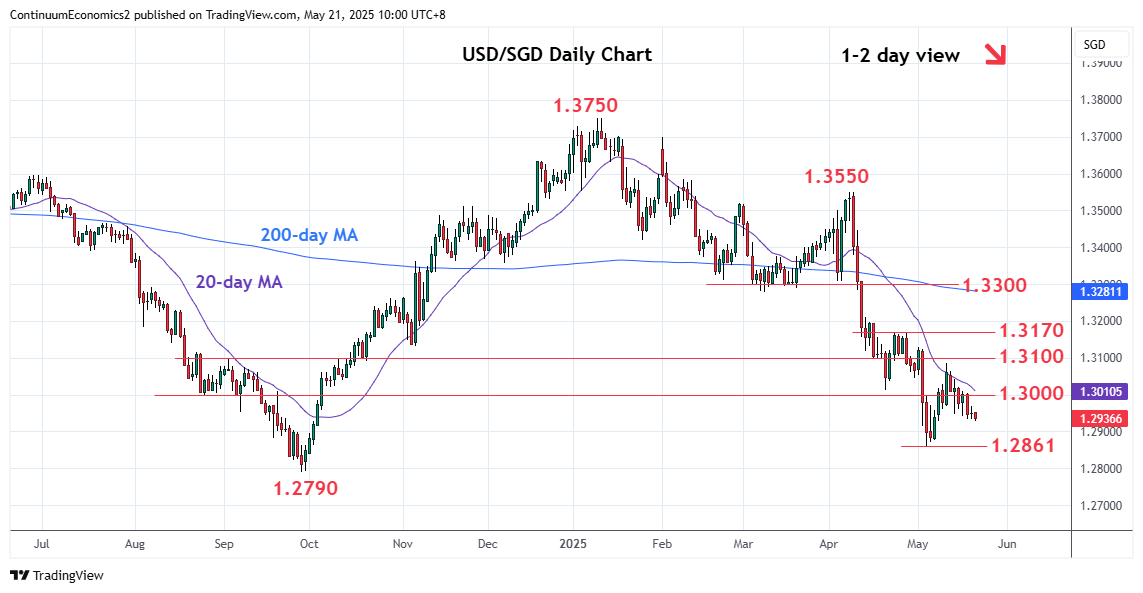
Prices remains under pressure with break of the 1.2950 congestion opening up room to the 1.2900 congestion
| Level | Comment | Level | Comment | ||||
|---|---|---|---|---|---|---|---|
| R4 | 1.3170 | ** | 23 Apr high, 50% | S1 | 1.2900 | * | congestion |
| R3 | 1.3100/30 | * | congestion, 1 May high | S2 | 1.2861 | ** | 5 May YTD low |
| R2 | 1.3080 | * | 38.2% Apr/May fall | S3 | 1.2790 | ** | Sep 2024 multi-year low |
| R1 | 1.3000/10 | * | congestion, Apr low | S4 | 1.2700 | * | congestion from Oct 2014 |
Asterisk denotes strength of level
02:10 GMT - Prices remains under pressure with break of the 1.2950 congestion opening up room to the 1.2900 congestion. Daily studies continue to deteriorate and suggest scope for break here to open the 1.2861, 5 May current year low to retest. Break here will turn focus to the 1.2790, September 2024 multi-year low. Would expect reaction here as weekly studies push deep into oversold areas. Meanwhile, resistance remains at the 1.3000/10 congestion and April low which is expected to cap. Clearance here will ease downside pressure and open up room for bounce to retest 1.3080 Fibonacci level.