Continuum Economics
  • Search
  • About Us
  • Buy
  • Invite A Friend
  • My Basket
  • Articles
  • Calendar
  • Forecasts
  • Events
  • Data
  • Newsletters
  • My Alerts
  • Community
  • Directory
  • About Us
  • Buy
  • Invite A Friend
  • My Basket
  • Articles
    • All
    • Thematic
    • Tactical
    • Asia
    • EMEA
    • Americas
    • Newsletters
    • Freemium
    • Editor's Choice
    • Most Viewed
    • Most Shared
    • Most Liked
  • Calendar
    • Interactive
      • China
      • United States
      • Eurozone
      • United Kingdom
    • Month Ahead
    • Reviews
    • Previews
  • Forecasts
    • Forecasts
    • Key Views
  • Events
    • Media
    • Conference Calls
  • Data
    • Country Insights
    • Shadow Credit Ratings
    • Full CI Data Download
  • Newsletters
  • My Alerts
  • Community
    • FX
    • Fixed Income
    • Macro Strategy
    • Credit Markets
    • Equities
    • Commodities
    • Precious Metals
    • Renewables
  • Directory
  • My Account
  • Notifications Setup
  • Account Details
  • Recent Devices
  • Distribution Lists
  • Shared Free Trials
  • Saved Articles
  • Shared Alerts
  • My Posts
Published: 2024-02-26T08:23:29.000Z

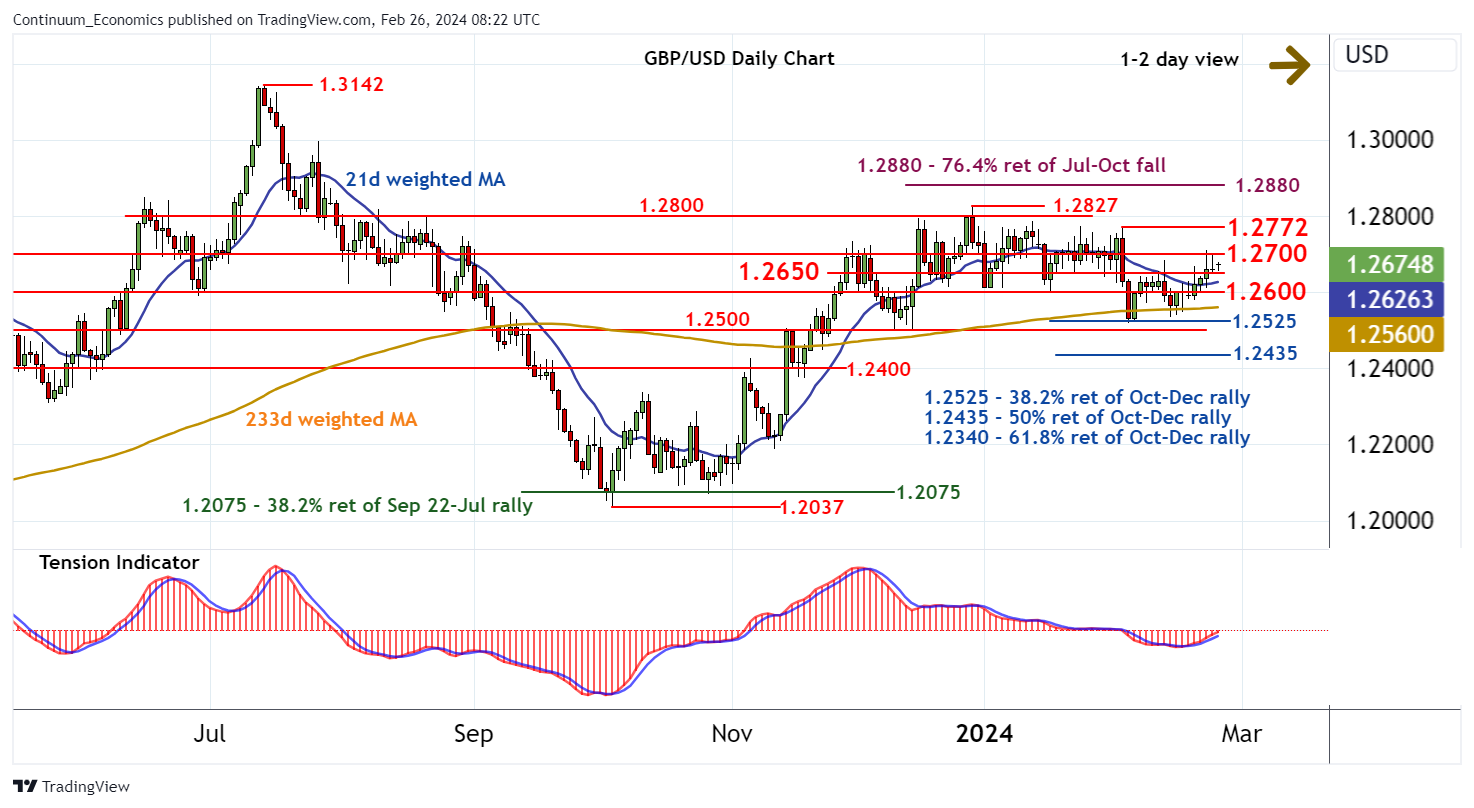
Chart GBP/USD Update: Consolidating - limited tests higher

byMike Macdonald

Senior Technical Strategist
-

The anticipated retest of resistance at 1.2700 is giving way to further consolidation


Level 
 
Comment 
 
 
Level 
 
Comment 
R4 1.2800*congestion                             
 
S1 1.2650 minor congestion 
R3 1.2772*2 Feb (w) high
 
S2 1.2600*congestion                         
R2 1.2760*intraday congestion
 
S3 1.2525**38.2% ret of Oct-Dec rally
R1 1.2700*break level
 
S4 1.2500*congestion

Asterisk denotes strength of level


08:05 GMT - The anticipated retest of resistance at 1.2700 is giving way to further consolidation, as intraday studies turn down and keep near-term sentiment cautious. The daily Tension Indicator remains positive, suggesting potential for a move back to 1.2700. However, flattening overbought daily stochastics and negative weekly charts should limit any break in fresh selling interest beneath the 1.2772 weekly high of 2 February. Meanwhile, support remains 1.2650. A later break beneath here will open up congestion around 1.2600, with further slippage adding weigh to sentiment and putting focus on the 1.2525 Fibonacci retracement.

Continue to read the article for free
Login

or

or

Topics
GBP/USD-TA
Free-Tactical-TA
DM-Technical
Technical Analysis

GENERAL

  • Home
  • About Us
  • Our Team
  • Careers

LEGAL

  • Terms and Conditions
  • Privacy Policy
  • Compliance
  • GDPR

GET IN TOUCH

  • Contact Us
Continuum Economics
The Technical Analyst Awards Winner 2021
The Technical Analyst Awards Finalist 2020
image