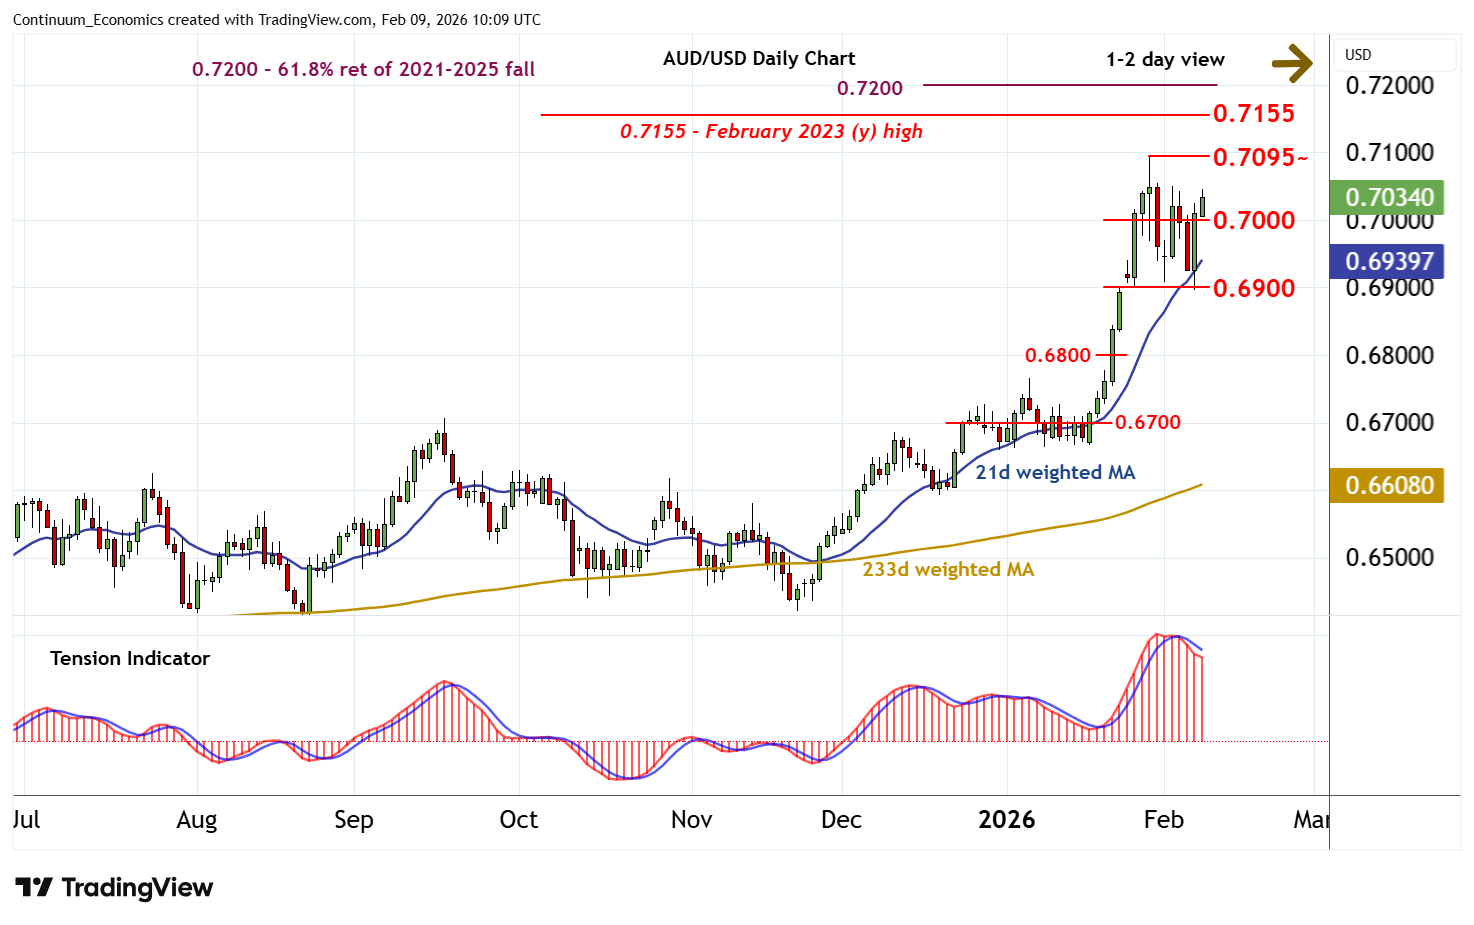
Chart AUD/USD Update: Strong resistance at 0.7095
The sharp bounce from strong support at 0.6900 has reached 0.7030
| Levels | Imp | Comment | Levels | Imp | Comment | |||
|---|---|---|---|---|---|---|---|---|
| R4 | 0.7200 | ** | 61.8% ret of 2021-2025 fall | S1 | 0.7000 | * | congestion | |
| R3 | 0.7155~ | ** | February 2023 (y) high | S2 | 0.6900 | ** | break level | |
| R2 | 0.7095~ | ** | 29 Jan YTD high | S3 | 0.6800 | ** | break level | |
| R1 | 0.7050 | minor congestion | S4 | 0.6700 | * | congestion |
Asterisk denotes strength of level
09:50 GMT - The sharp bounce from strong support at 0.6900 has reached 0.7030. Intraday studies are mixed/positive, suggesting room for continuation towards minor resistance at 0.7050. But negative daily stochastics and the bearish daily Tension Indicator should limit any break in renewed selling interest/consolidation towards critical resistance at the 0.7095~ current year high of 29 January. Broader weekly charts are positive and longer-term readings are also rising, highlighting room for a later break and continuation of April 2025 gains towards strong resistance within the 0.7155~ year high of February 2023 and the 0.7200 Fibonacci retracement. Meanwhile, support is at congestion around 0.7000. A test back beneath here, if seen, should meet renewed buying interest towards 0.6900.