Published: 2026-03-27T00:45:33.000Z
Chart NZD/USD Update: Still heavy, room to .5710 January low
1
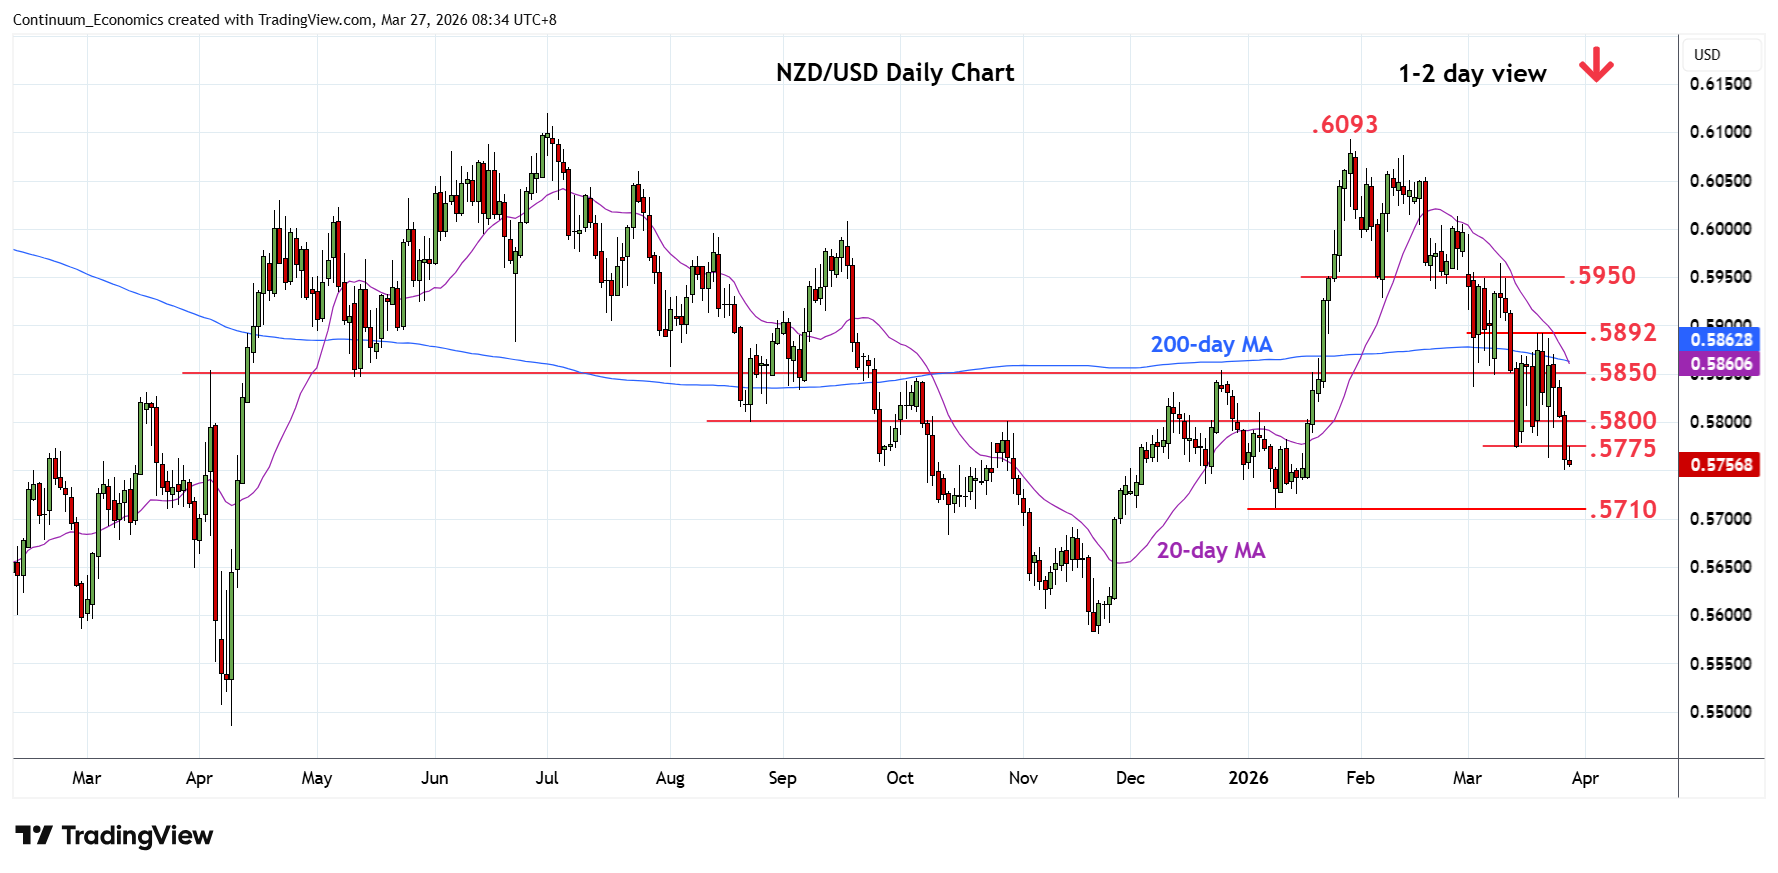
Choppy trade above the .5775 low finally gave way to break to extend losses from the January YTD high to reach .5750
| Levels | Imp | Comment | Levels | Imp | Comment | |||
|---|---|---|---|---|---|---|---|---|
| R4 | .5900 | * | congestion | S1 | .5750 | * | congestion | |
| R3 | .5892 | ** | 19 Mar high | S2 | .5710/00 | ** | 9 Jan YTD low, 76.4% | |
| R2 | .5850 | * | congestion | S3 | .5650 | * | congestion | |
| R1 | .5800 | * | congestion | S4 | .5600 | * | congestion |
Asterisk denotes strength of level
00:35 GMT - Choppy trade above the .5775 low finally gave way to break to extend losses from the January YTD high to reach the .5750 congestion. Daily and weekly studies continues to track lower and suggest scope for break here to open the 9 January current year low at .5710 to retest. Would expect reaction here and the .5700, 76.4% Fibonacci retracement. However, a later break cannot be ruled out. Meanwhile, resistance is lowered to the .5800/50 congestion area which is expected to cap and sustain losses from the January high.