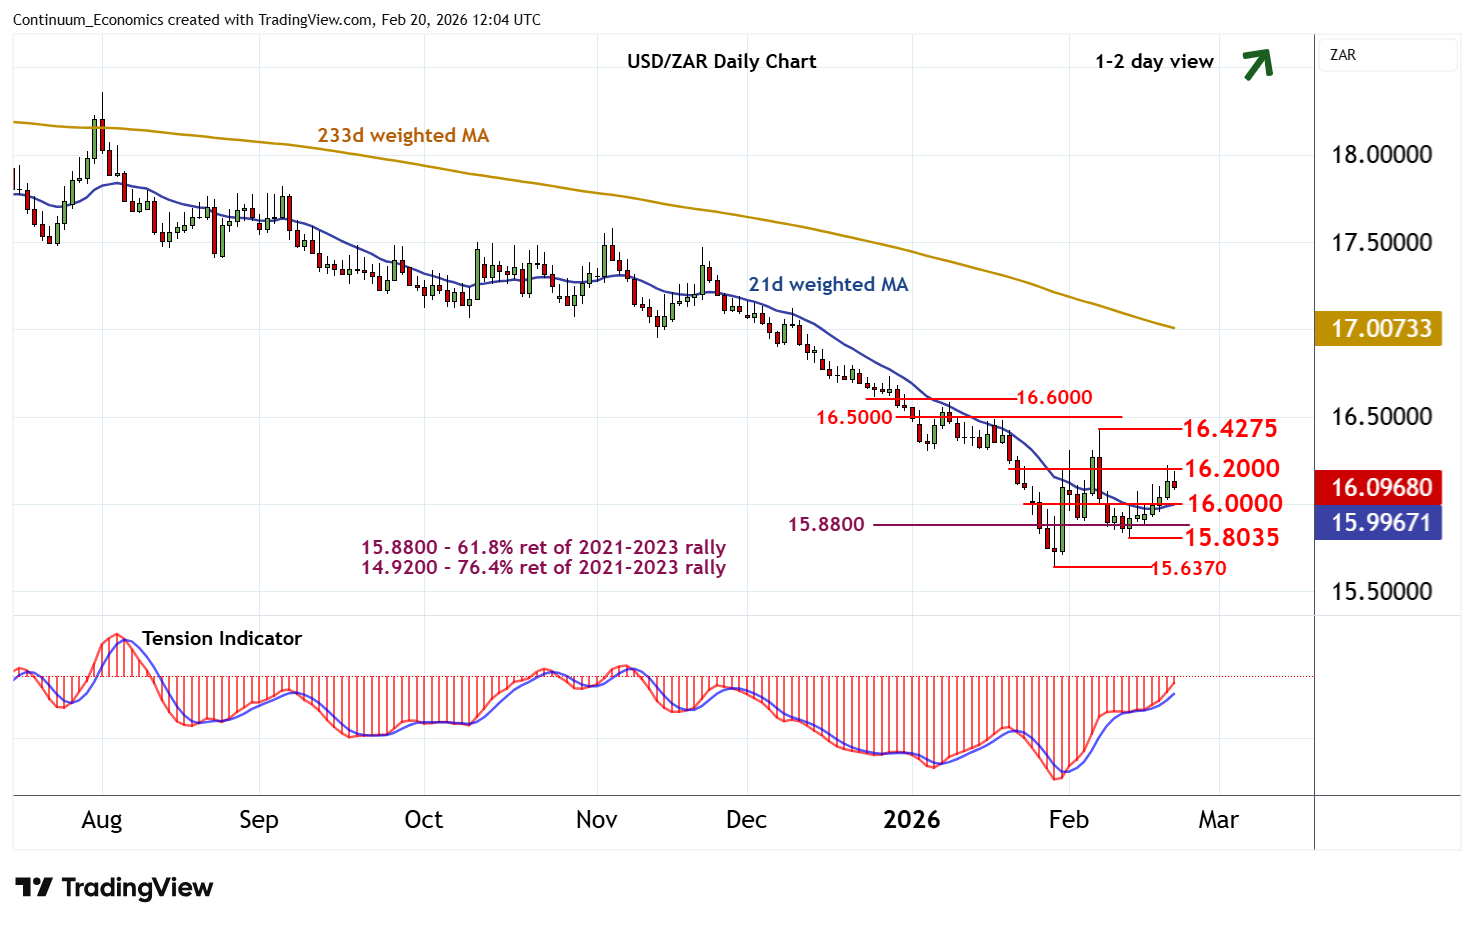
Chart USD/ZAR Update: Minor reactions - studies remain positive
The test of congestion resistance at 16.2000 is giving way to a minor pullback
| Level | Comment | Level | Comment | |||||
|---|---|---|---|---|---|---|---|---|
| R4 | 16.6000 | break level | S1 | 16.0000 | ** | congestion | ||
| R3 | 16.5000 | break level | S2 | 15.8035 | * | 12 Feb (w) low | ||
| R2 | 16.4275 | * | 6 Feb (w) high | S3 | 15.6370 | ** | 29 Jan YTD low | |
| R1 | 16.2000 | minor congestion | S4 | 15.1665 | * | June 2022 low |
Asterisk denotes strength of level
11:45 GMT - The test of congestion resistance at 16.2000 is giving way to a minor pullback, as intraday studies turn down, with prices currently trading around 16.1000. However, daily readings are positive and broader weekly charts are improving, suggesting any deeper losses should be limited in renewed buying interest towards congestion support at 16.0000. Following cautious trade, fresh gains are looked for. A later break above 16.2000 will open up the 16.4275 weekly high of 6 February. But already overbought daily stochastics could limit any initial tests in profit-taking/consolidation. Meanwhile, a break below 16.0000, if seen, will stabilise price action and prompt consolidation above the 15.8035 weekly low of 12 February.