Published: 2025-06-03T08:26:55.000Z
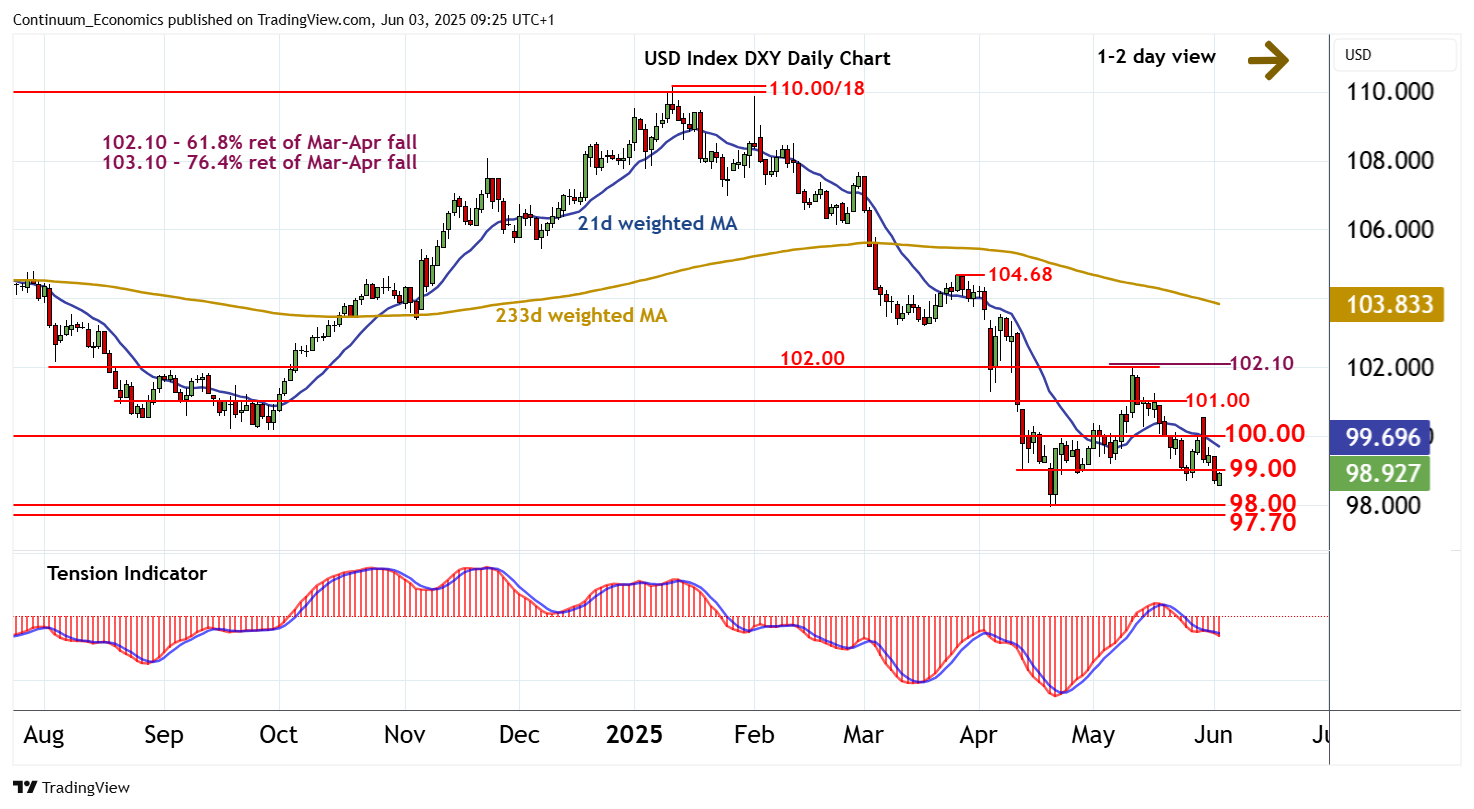
Chart USD Index DXY Update: Gains to remain limited

Senior Technical Strategist
1
The break below 99.00 has reached 98.58
| Levels | Imp | Comment | Levels | Imp | Comment | |||
|---|---|---|---|---|---|---|---|---|
| R4 | 102.00 | ** | break level | S1 | 98.58 | intraday low | ||
| R3 | 101.00 | * | break level | S2 | 98.00 | * | congestion | |
| R2 | 100.00 | ** | congestion | S3 | 97.70 | * | early-Mar 22 (w) low | |
| R1 | 99.00 | break level | S4 | 96.50 | ** | congestion |
Asterisk denotes strength of level
09:15 BST - The break below 99.00 has reached 98.58, where unwinding oversold intraday studies are prompting a bounce back to 99.00. A test above here cannot be ruled out. But negative daily and weekly charts are expected to limit scope in renewed selling interest/consolidation beneath resistance at 100.00. Following cautious/corrective trade, fresh losses are looked for. A break below 98.58 will open up critical support at the 97.70 weekly low of early-March 2022 and congestion around 98.00. A further close beneath here will turn sentiment outright negative and extend September 2022 losses initially towards congestion around 96.50.