Published: 2026-03-09T00:46:12.000Z
Chart NZD/USD Update: Under pressure
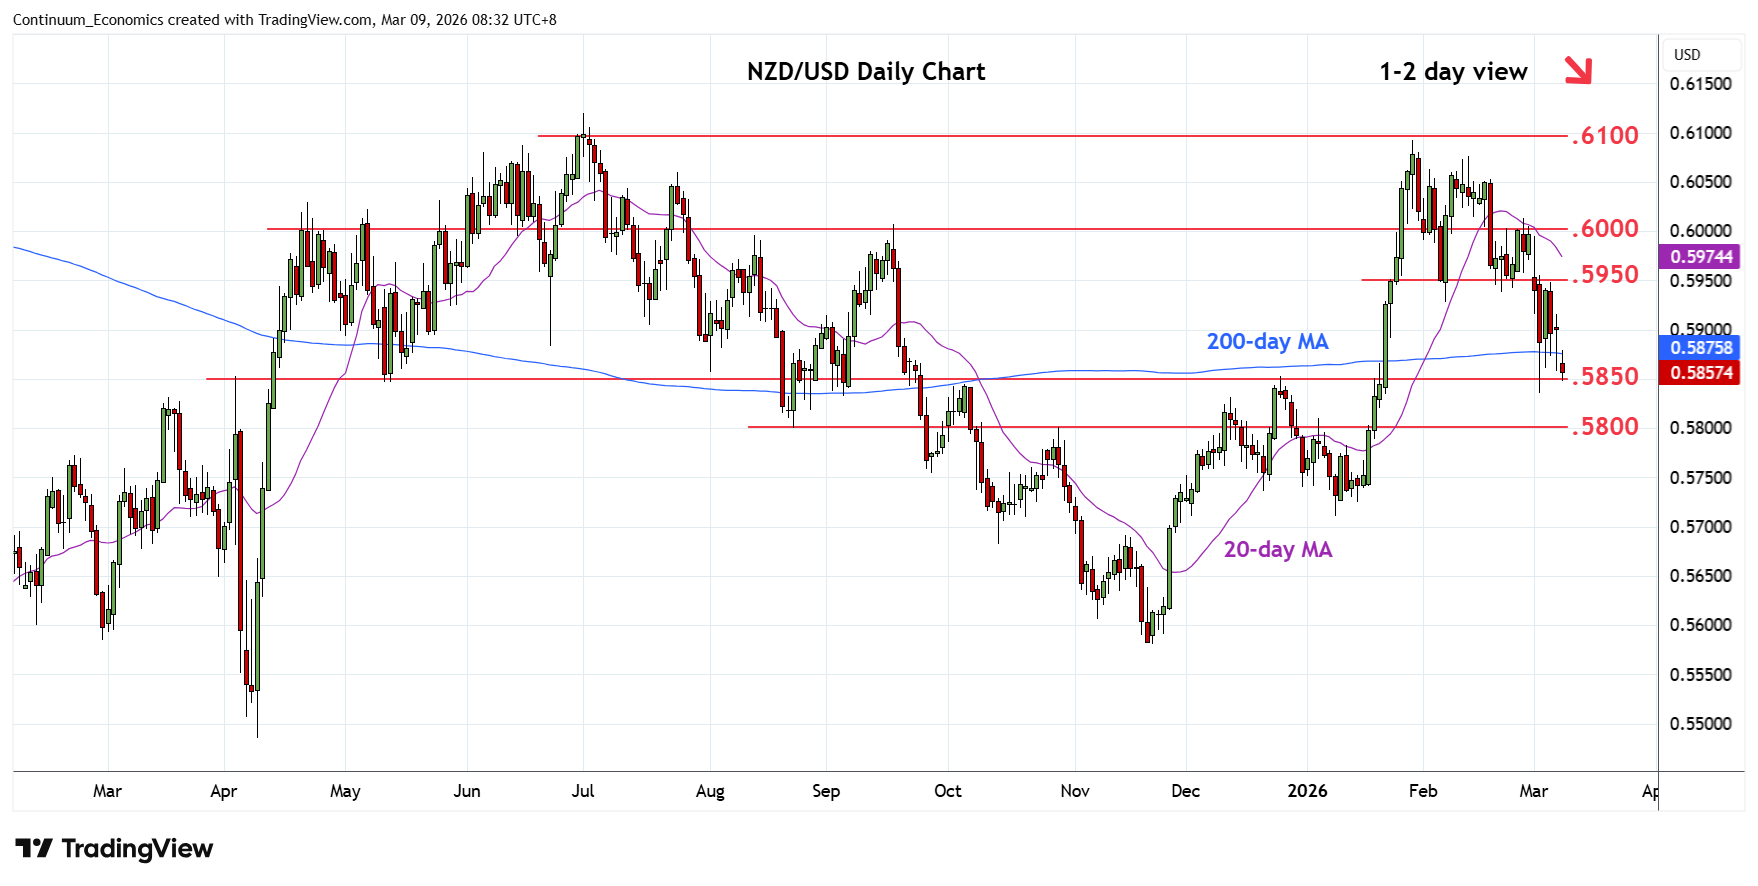
1
Gapped down at the open see prices back to retest support at the .5850/36 congestion and low of 3 March
| Levels | Imp | Comment | Levels | Imp | Comment | |||
|---|---|---|---|---|---|---|---|---|
| R4 | .6050 | * | congestion | S1 | .5850 | * | Dec high, congestion | |
| R3 | .6000/10 | ** | congestion, 26 Feb high | S2 | .5836 | * | 3 Mar low, 50% | |
| R2 | .5930/50 | ** | Feb low, congestion | S3 | .5800 | ** | congestion | |
| R1 | .5900 | * | congestion | S4 | .5775 | * | 61.8% Nov/Jan rally |
Asterisk denotes strength of level
00:35 GMT - Gapped down at the open see prices back to retest support at the .5850/36 congestion and low of 3 March. Negative daily and weekly studies suggest scope for break here to further extend losses from the January current year high just below the .6100 level towards .5800 level then .5775, 61.8% Fibonacci level. Meanwhile, resistance is lowered to the .5900 level and this extend to the strong resistance at the .5930/50, February low and congestion area. This area nw expected to cap and sustain losses from the .6076/.6093, February/January highs.