Published: 2026-04-30T01:07:37.000Z
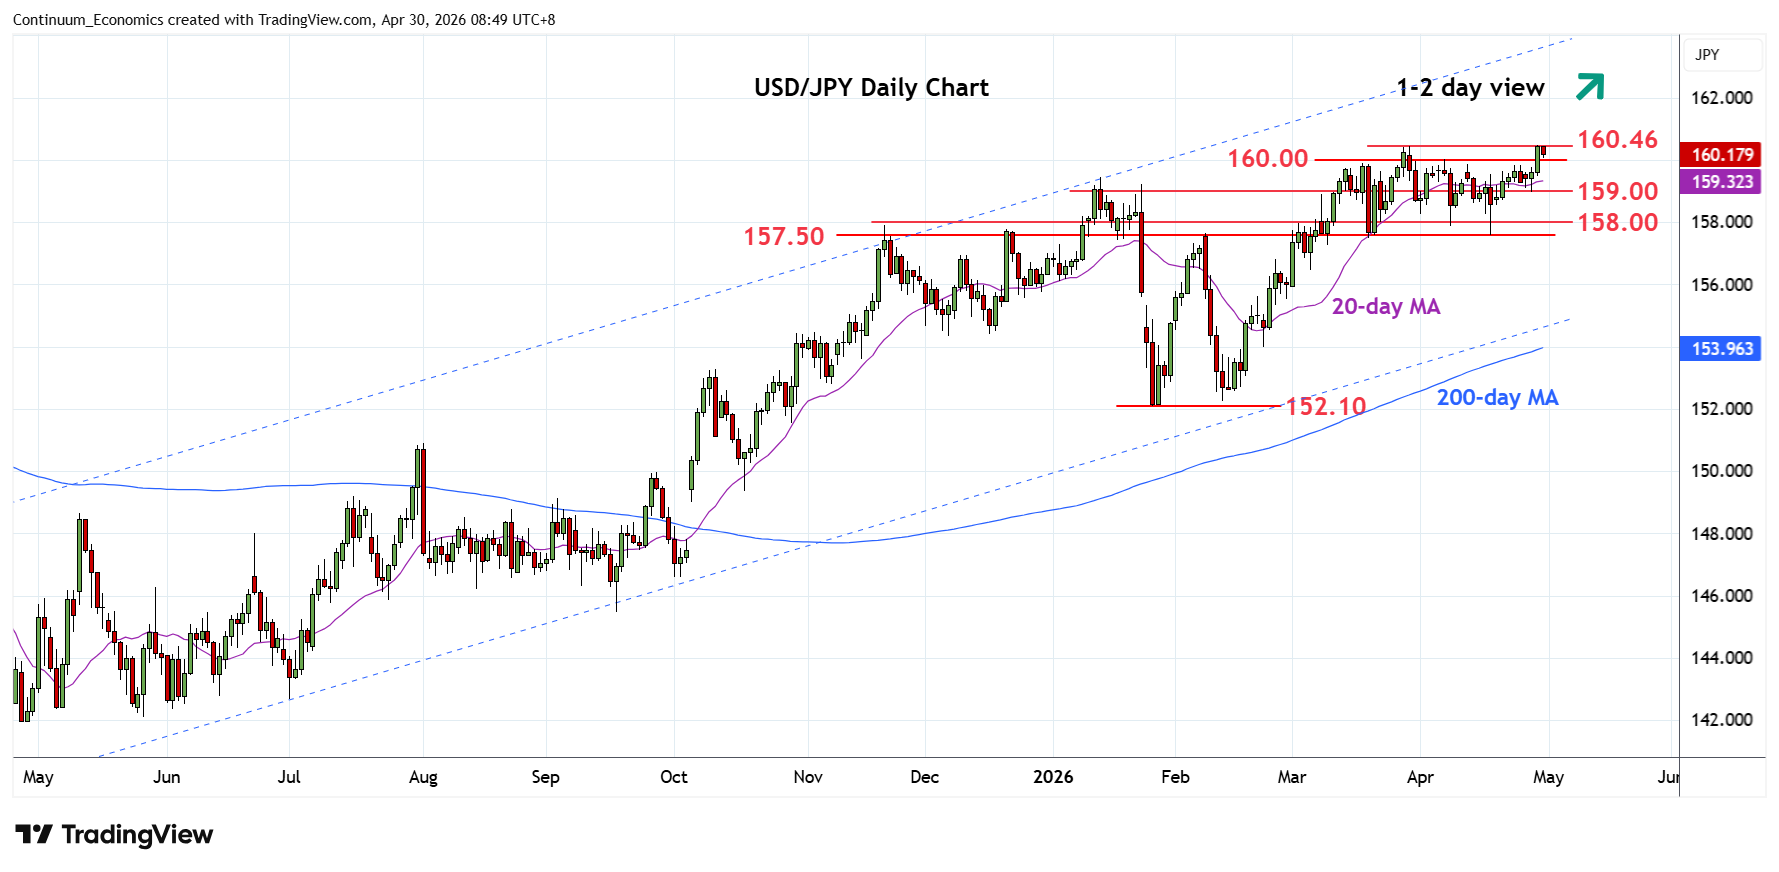
Chart USD/JPY Update: Consolidating retest of 160.46 YTD high
3
Bounce from the 159.00 level has seen gains to retest the March current year high at 160.46
| Levels | Imp | Comment | Levels | Imp | Comment | |||
|---|---|---|---|---|---|---|---|---|
| R4 | 163.00 | * | congestion | S1 | 160.00 | * | congestion | |
| R3 | 161.95 | ** | Jul 2024 multi-yr high | S2 | 159.85 | ** | 23 Apr high | |
| R2 | 161.00 | * | congestion | S3 | 159.00 | * | congestion | |
| R1 | 160.46 | ** | 30 Mar YTD high | S4 | 158.00 | ** | congestion |
Asterisk denotes strength of level
01:00 GMT - Bounce from the 159.00 level has seen gains to extend the broader gains from the 157.50 low of 17 April to retest the March current year high at 160.46. Reaction here see prices unwinding overbought intraday studies but a later break cannot be ruled out. Clearance here will turn focus to the 161.95 multi-year high of July 2024. Meanwhile, support is raised to the 160.00/159.85 recent April highs which should now underpin. Break here will ease the upside pressure and see room for return to the 159.00 support.