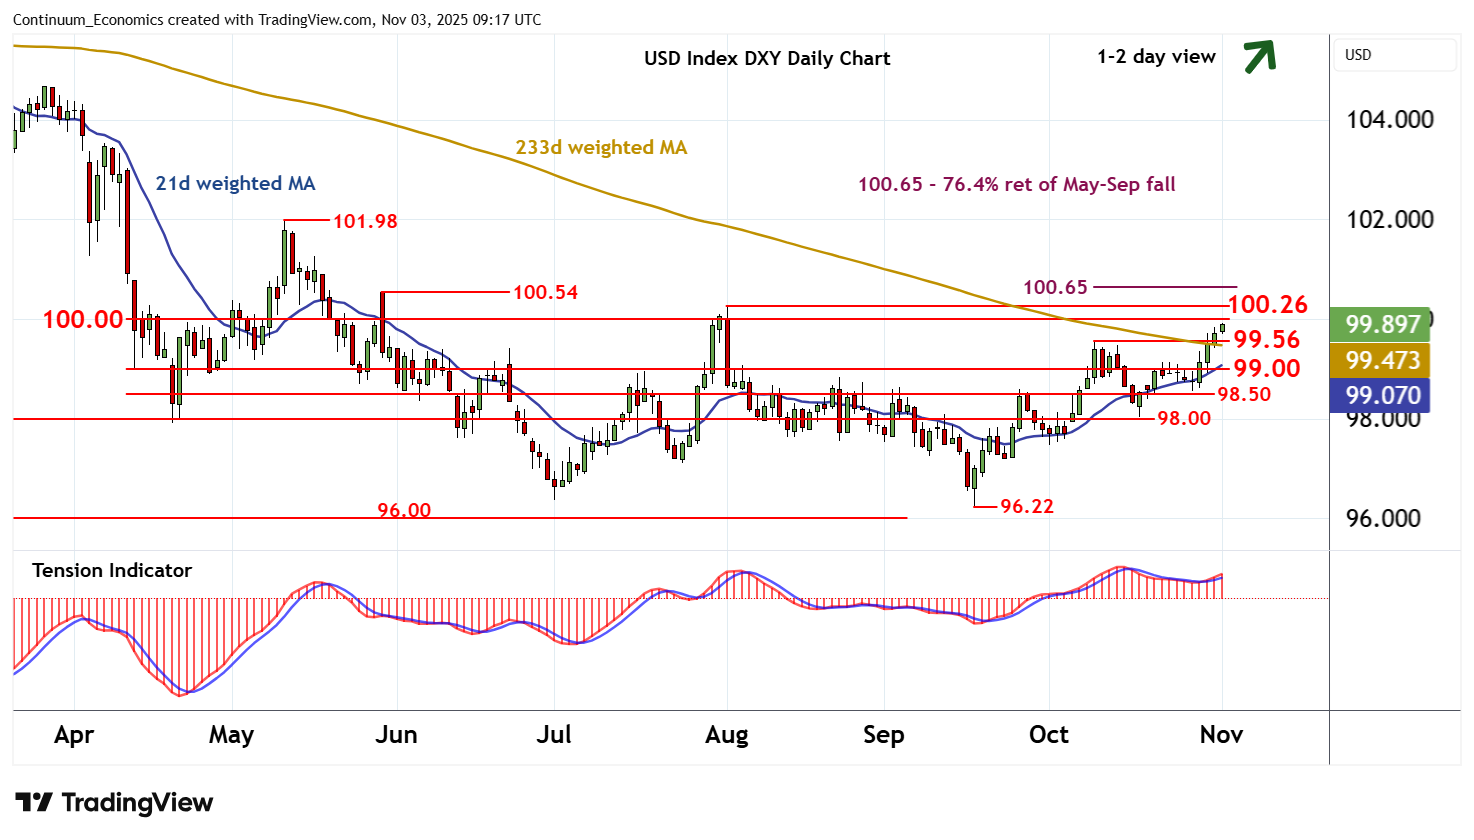
Chart USD Index DXY Update: Approaching strong resistance at 100.00/26
Consolidation around 99.75 has given way to a fresh push higher
| Levels | Imp | Comment | Levels | Imp | Comment | |||
|---|---|---|---|---|---|---|---|---|
| R4 | 100.65 | ** | 76.4% ret of May-Sep fall | S1 | 99.56 | ** | 9 Oct (w) high | |
| R3 | 100.54 | ** | 29 May (w) high | S2 | 99.00 | * | congestion | |
| R2 | 100.26 | ** | 1 Aug (m) high | S3 | 98.50 | * | congestion | |
| R1 | 100.00 | ** | congestion | S4 | 98.00 | * | congestion |
Asterisk denotes strength of level
09:05 GMT - Consolidation around 99.75 has given way to a fresh push higher, with prices approaching strong resistance at congestion around 100.00 and the 100.26 monthly high of 1 August. Daily readings continue to rise and broader weekly charts are improving, highlighting room for fresh gains. A close above 100.26 would further improve sentiment and extend mid-September gains initially to the 100.54 weekly high of 29 May and the 100.65 Fibonacci retracement. However, already overbought daily stochastics are expected to limit any initial tests of this range in profit-taking/consolidation. Meanwhile, a close back below the 99.56 weekly high of 9 October would help to stabilise price action and prompt consolidation above congestion support at 99.00.