Published: 2026-04-01T00:44:31.000Z
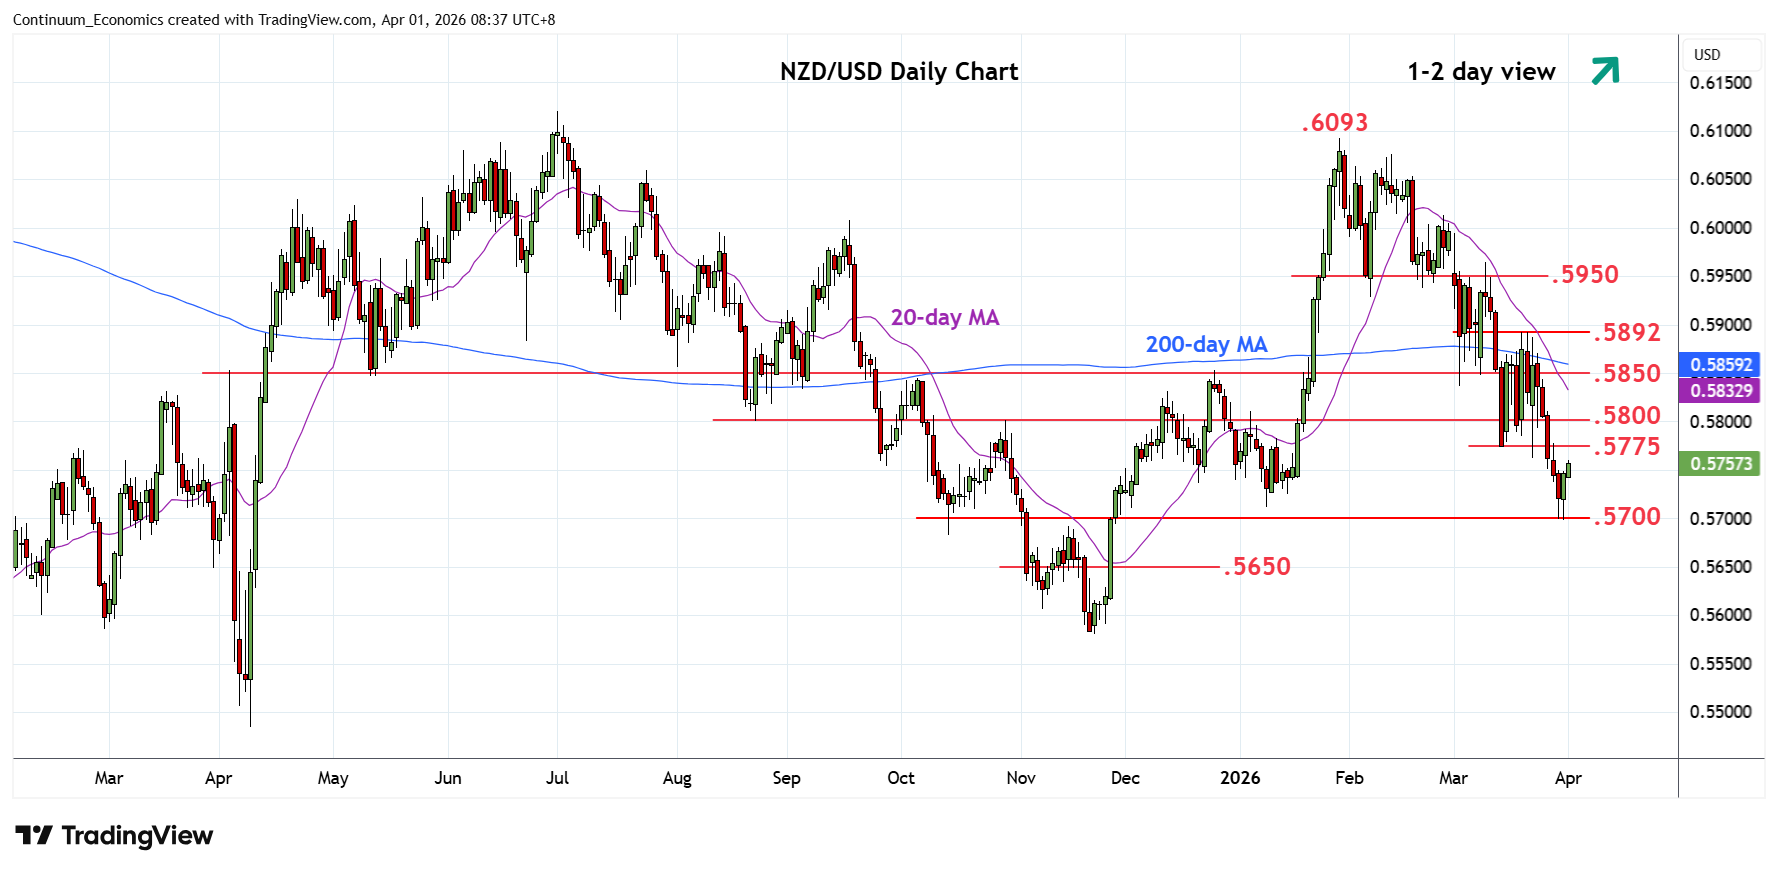
Chart NZD/USD Update: Extending bounce from .5700 Fibonacci level
1
Consolidation at the .5700 Fibonacci level has given way to bounce as prices unwind oversold intraday and daily studies
| Levels | Imp | Comment | Levels | Imp | Comment | |||
|---|---|---|---|---|---|---|---|---|
| R4 | .5892 | ** | 19 Mar high | S1 | .5700 | * | 30 Mar YTD low, 76.4% | |
| R3 | .5850 | ** | congestion | S2 | .5650 | * | congestion | |
| R2 | .5800 | * | congestion | S3 | .5606 | * | 7 Nov low | |
| R1 | .5775 | * | 13 Mar low | S4 | .5578 | ** | 21 Nov low |
Asterisk denotes strength of level
00:40 GMT - Consolidation at the .5700 Fibonacci level has given way to bounce as prices unwind oversold intraday and daily studies. Above the .5750 congestion see room for strong gains to resistance at the .5775/.5800 congestion area which is expected to cap. Break here will ease the downside pressure and see room to the strong resistance at the .5850/92 area. Meanwhile, support at the .5700 low now underpin. Would take break here to opens up room for extension to the .5650 congestion. Below here will return focus to the .5606/.5578, November lows.