Published: 2025-03-20T05:48:13.000Z
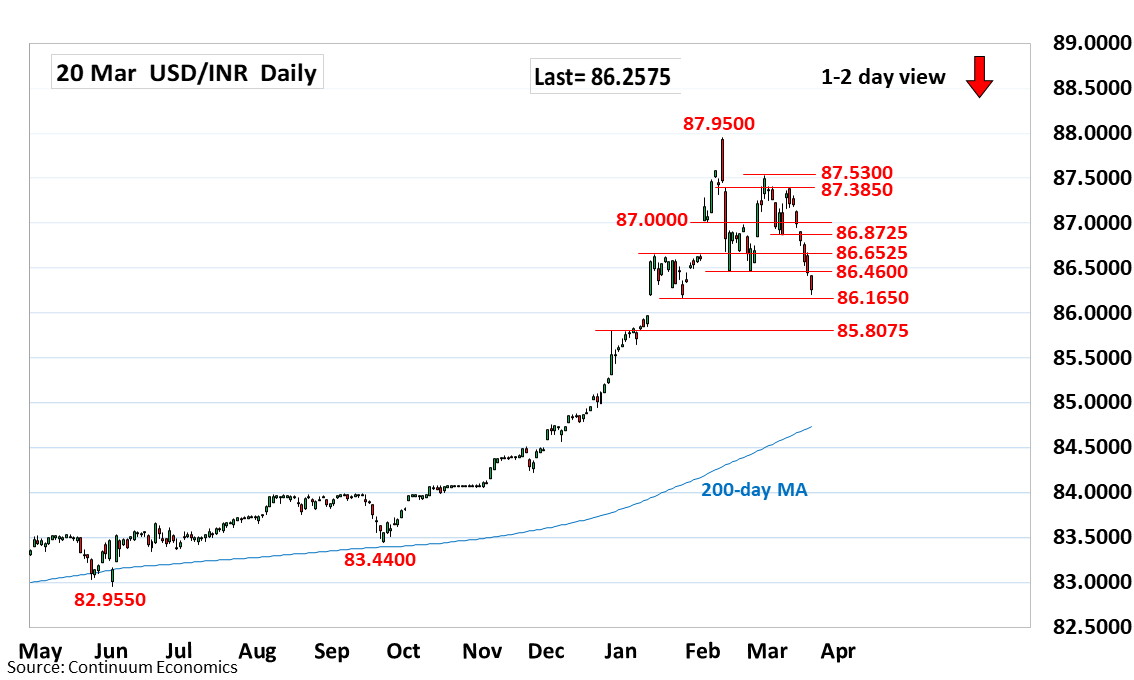
Chart USD/INR Update: Extending losses

Technical Analyst
-
Break of the February low at 86.4600 extend losses from the 87.9500 all-time high to correct gains from the September low

| Level | Comment | Level | Comment | |||||
|---|---|---|---|---|---|---|---|---|
| R4 | 87.0000 | * | 4 Feb low | S1 | 86.1650 | * | 24 Jan low | |
| R3 | 86.8725 | ** | 7 Mar low | S2 | 86.0000 | * | figure | |
| R2 | 85.6525 | * | Jan high | S3 | 85.9700 | * | 10 Jan high, gap | |
| R1 | 86.4600 | ** | Feb low | S4 | 85.8075 | * | Dec high |
Asterisk denotes strength of level
05:45 GMT - Break of the February low at 86.4600 extend losses from the 87.9500 all-time high to correct gains from the September low. Lower will see room to the 86.1650 support then the 86.0000 figure where reaction can be expected as daily studies extend deep into oversold areas. However, consolidation here expected to give way to further losses later to support at the 85.9700 and 85.8075, previous highs. Meanwhile, resistance is lowered to the 86.4600 low of February which is expected to cap and sustain losses from the 87.5300/87.9500 highs.