Published: 2026-04-14T01:00:18.000Z
Chart USD/JPY Update: Lower in consolidation beneath 160.00
1
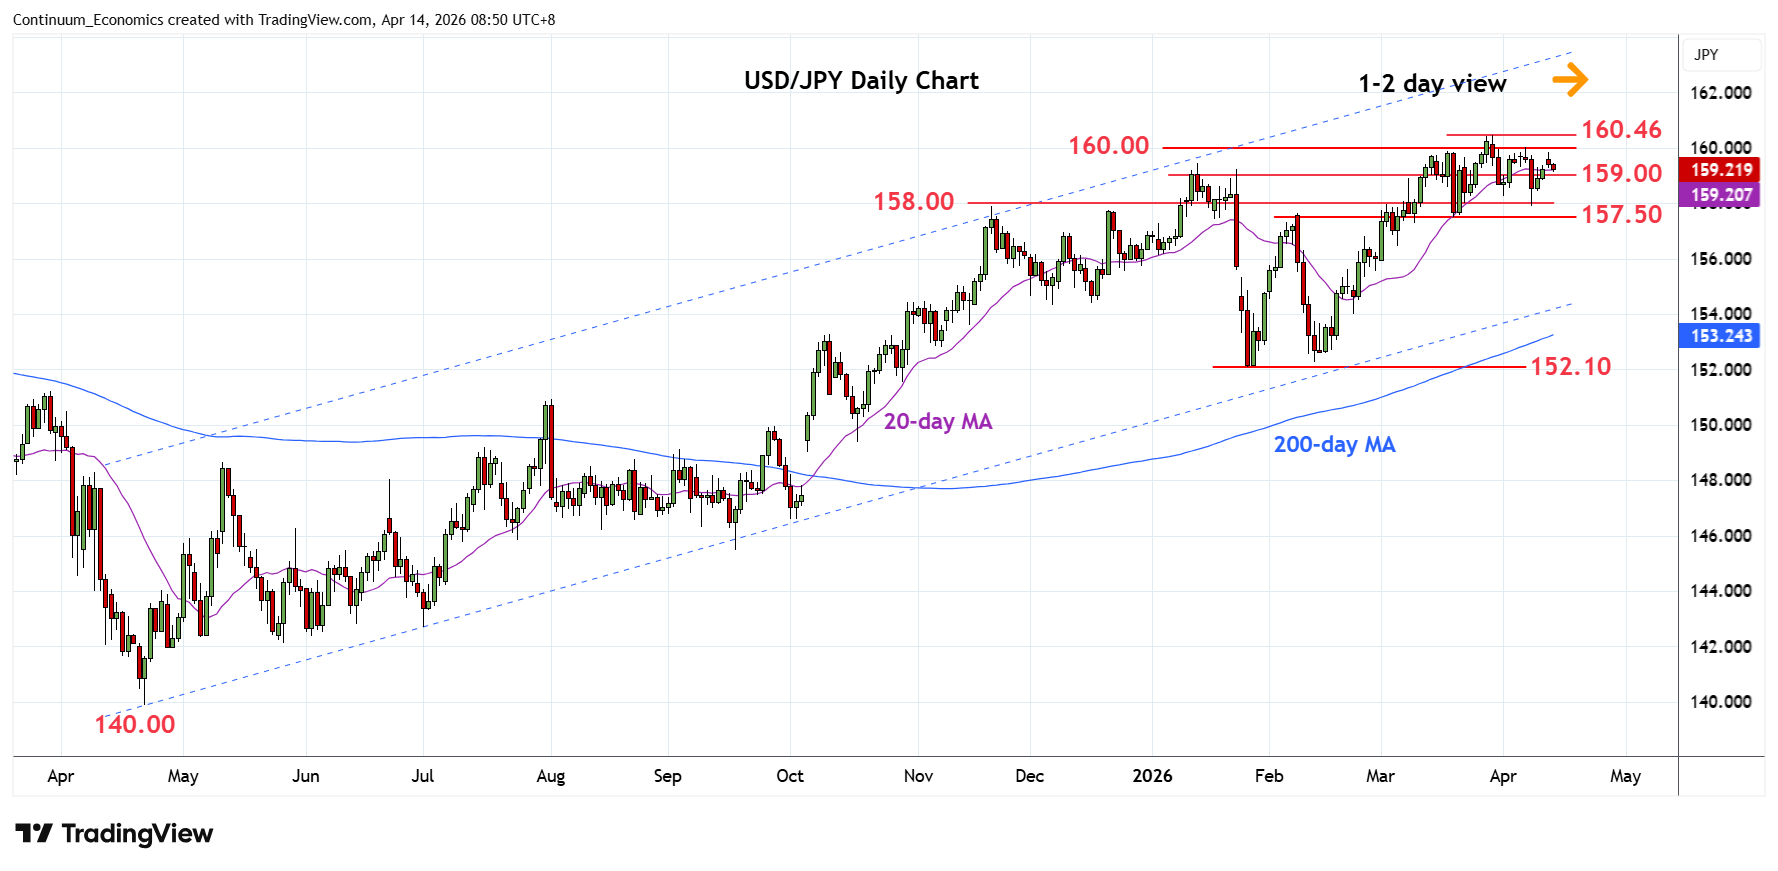
Turned lower in consolidation beneath the 160.00 figure after failing to sustain break of 159.45 resistance
| Levels | Imp | Comment | Levels | Imp | Comment | |||
|---|---|---|---|---|---|---|---|---|
| R4 | 161.95 | ** | July 2024 yr high | S1 | 159.00 | * | congestion | |
| R3 | 161.00 | * | congestion | S2 | 158.27/00 | ** | 1 Apr low, congestion | |
| R2 | 160.46 | ** | 30 Mar YTD high | S3 | 157.50 | ** | 19 Mar low | |
| R1 | 160.00 | * | figure, congestion | S4 | 157.25 | * | 38.2% Jan/Mar rally |
Asterisk denotes strength of level
00:50 GMT - Turned lower in consolidation beneath the 160.00 figure after failing to sustain break of 159.45 resistance. Mixed daily studies suggest this level should continue to limit bounce attempt and further extend consolidation here. Would take break to expose the 160.46 March current year high to retest and see room to extend the underlying bull trend from the 2011 low. Meanwhile, support remains at the 159.00 congestion which should underpin. Below this will open up room for retest of support at the 158.27/00 congestion then the 157.50, 19 March low.