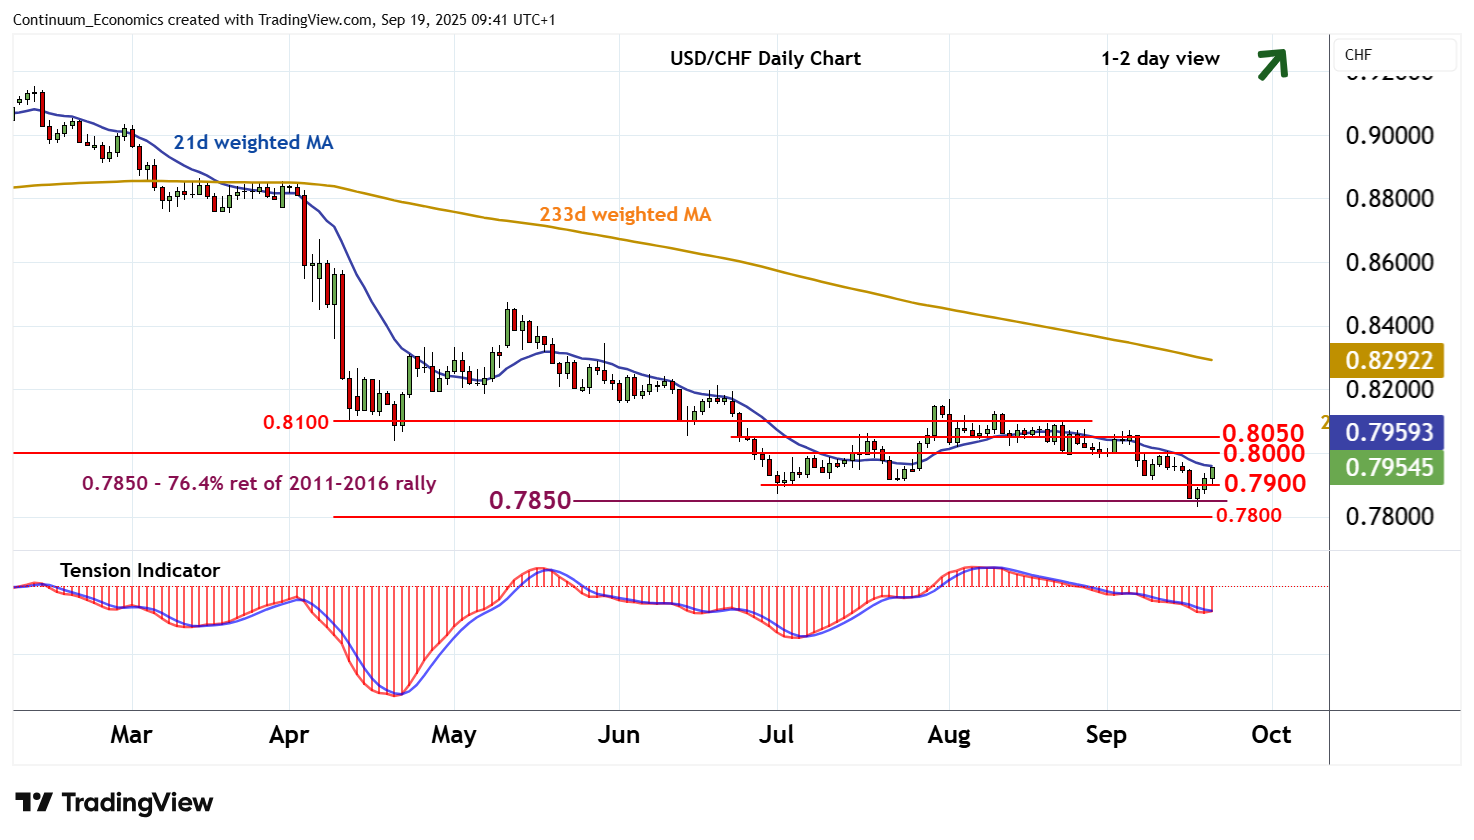
Chart USD/CHF Update: Extending corrective gains
The bounce from the 0.7829 current year low of 17 September is extending
| Level | Comment | Level | Comment | |||||
|---|---|---|---|---|---|---|---|---|
| R4 | 0.8170~ | ** | 1 Aug YTD high | S1 | 0.7900 | congestion | ||
| R3 | 0.8100 | * | congestion | S2 | 0.7850 | ** | 76.4% ret of 2011-2016 rally | |
| R2 | 0.8050 | break level | S3 | 0.7829 | 17 Sep YTD low | |||
| R1 | 0.8000 | ** | congestion | S4 | 0.7800 | * | figure |
Asterisk denotes strength of level
09:25 BST - The bounce from the 0.7829 current year low of 17 September is extending, with prices currently trading around 0.7950. Oversold daily stochastics are unwinding and the daily Tension Indicator is also turning up, suggesting room for continuation towards further congestion around 0.8000. However, negative weekly charts are expected to limit any immediate break above here in renewed selling interest/consolidation beneath 0.8050. Meanwhile, support is raised to congestion around 0.7900. Any immediate break beneath here should give way to consolidation above critical support within 0.7829 and the 0.7850 multi-year Fibonacci retracement.