Published: 2026-02-23T07:59:52.000Z
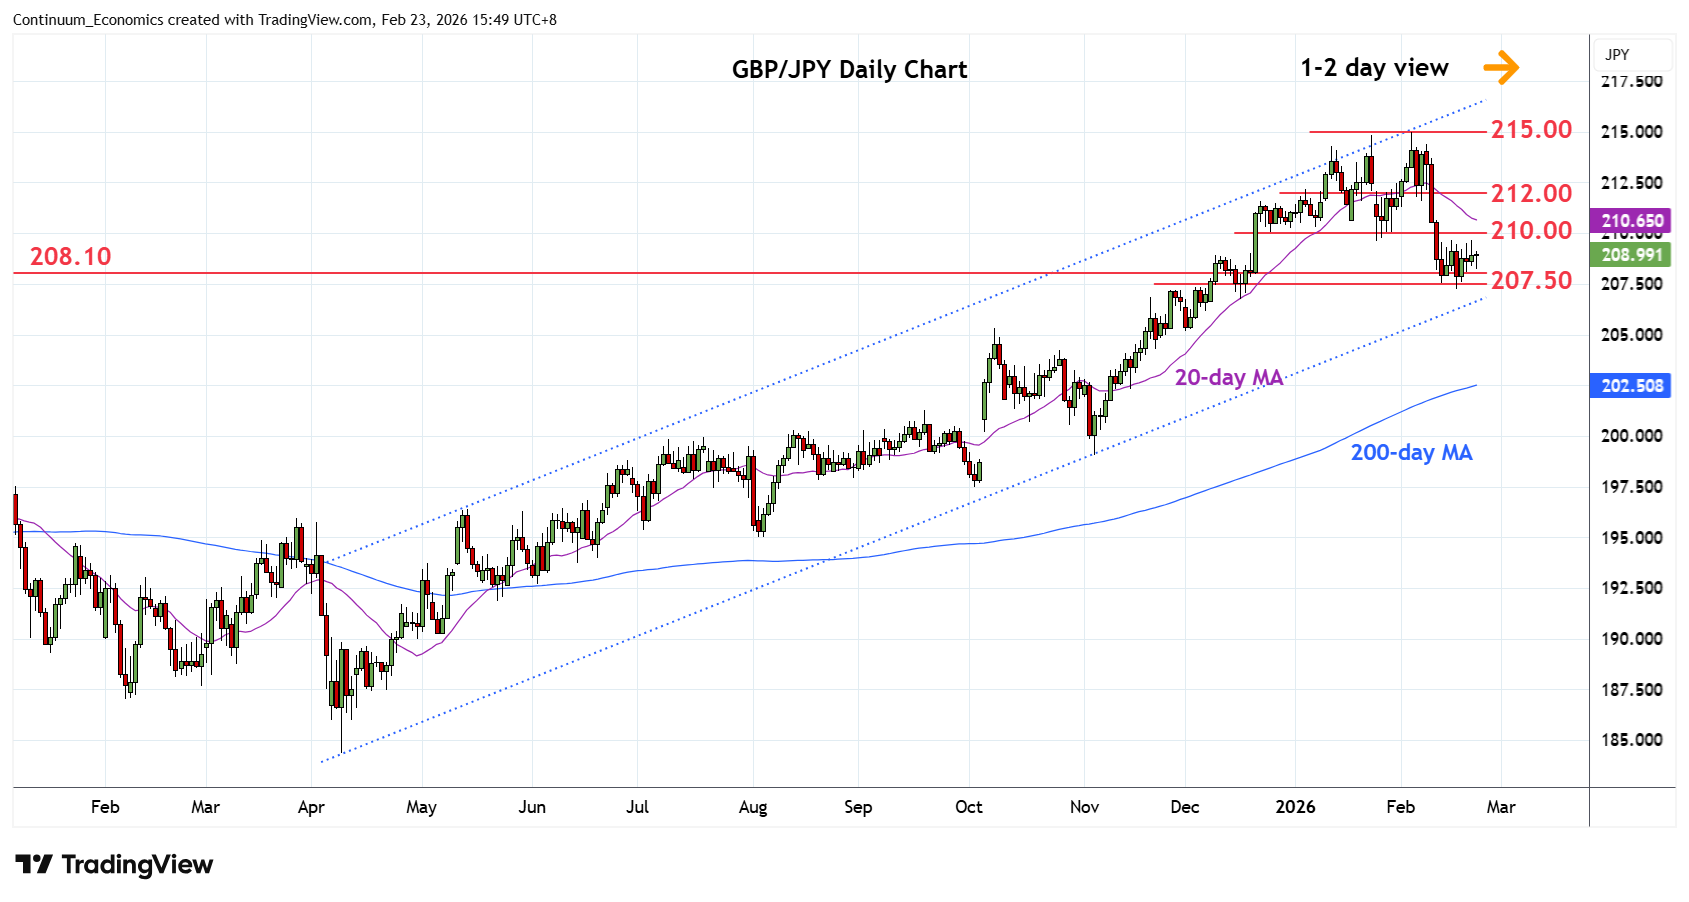
Chart GBP/JPY Update: Steady above the 208.10/207.50 support
-
Little change, as prices extend choppy trade above support at the 208.10/207.50 area
| Levels | Imp | Comment | Levels | Imp | Comment | |||
|---|---|---|---|---|---|---|---|---|
| R4 | 215.00 | ** | 4 Feb YTD high | S1 | 208.10 | * | 2024 year high | |
| R3 | 214.00/40 | * | congestion, 9 Feb high | S2 | 207.50 | * | congestion | |
| R2 | 212.00 | * | congestion | S3 | 206.00 | * | congestion | |
| R1 | 210.00 | * | congestion | S4 | 205.30/00 | * | Oct high, congestion |
Asterisk denotes strength of level
07:50 GMT - Little change, as prices extend choppy trade above support at the 208.10/207.50 area and consolidate losses from the 215.00, 4 February current year high. The resulting flag pattern suggest consolidation giving way to renewed selling pressure later to see deeper pullback to retrace gains from the April 2025 year low. Break will see room to support at the 206.00 congestion and 205.30/00 area. Meanwhile, resistance at the 210.00 level is expected to cap. Lift over this, if seen, will see room for stronger bounce to resistance at the 212.00 level.