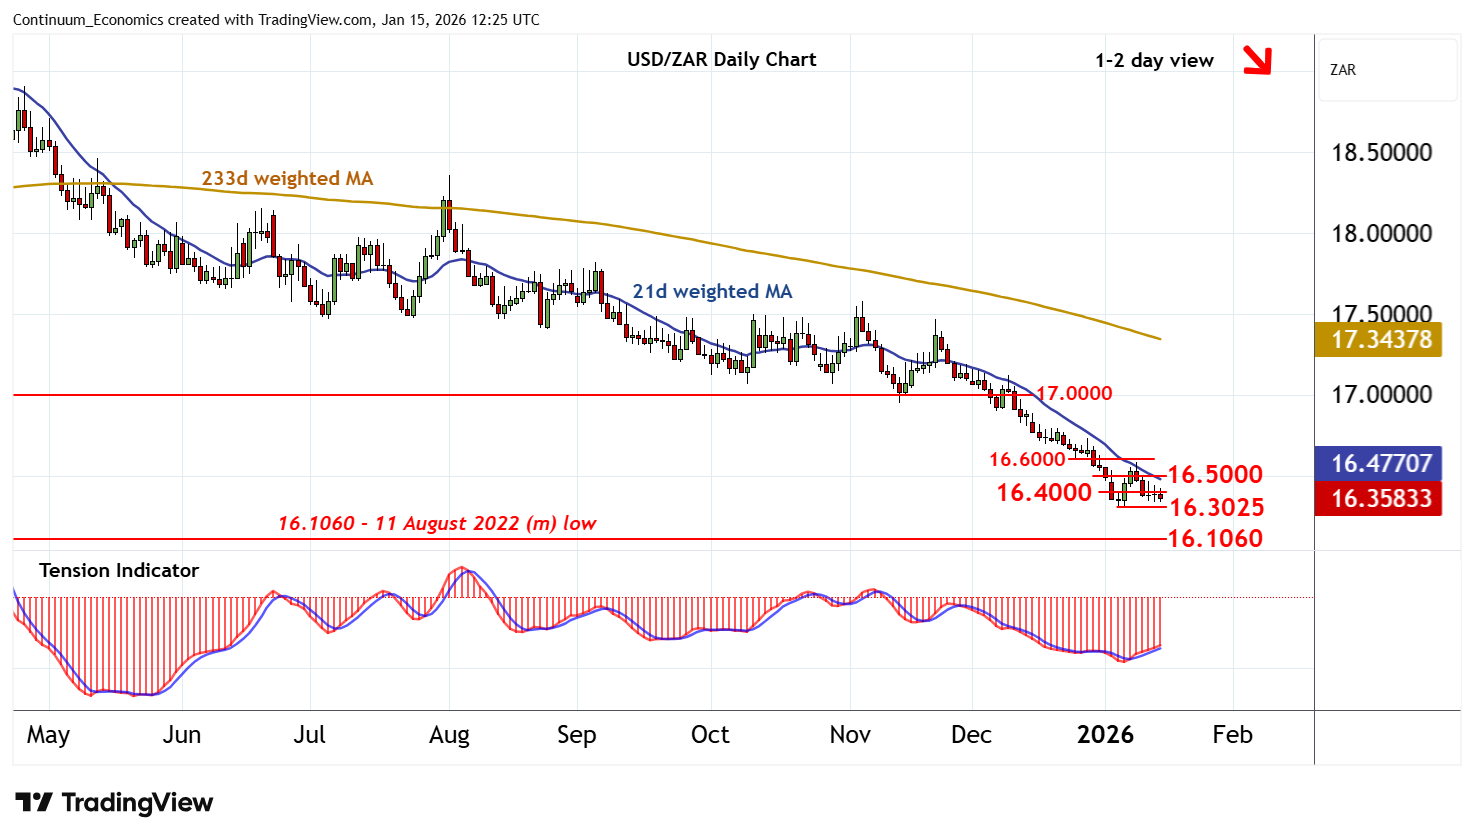
Chart USD/ZAR Update: Choppy trade - studies under pressure
The anticipated minor test above resistance at 16.4000 is giving way to fresh consolidation beneath here
| Level | Comment | Level | Comment | |||||
|---|---|---|---|---|---|---|---|---|
| R4 | 16.7000 | break level | S1 | 16.3025 | * | 6 Jan YTD low | ||
| R3 | 16.6000 | break level | S2 | 16.1060 | ** | 11 Aug 2022 (m) low | ||
| R2 | 16.5000 | break level | S3 | 16.0000 | ** | congestion | ||
| R1 | 16.4000 | break level | S4 | 15.8800 | ** | 61.8% ret of 2021-2023 rally |
Asterisk denotes strength of level
12:15 GMT - The anticipated minor test above resistance at 16.4000 is giving way to fresh consolidation beneath here, as intraday studies turn down. Daily readings are deteriorating and broader weekly charts are bearish, highlighting room for fresh losses in the coming sessions. Support is at the 16.3025 current year low of 6 January. A close beneath here is needed to turn sentiment negative and extend the April bear trend towards the 16.1060 monthly low of 11 August 2022 and historic congestion around 16.0000. Just lower is the 15.8800 Fibonacci retracement. But flat oversold weekly stochastics are expected to limit any initial tests of this broad 15.8800 - 16.1060 range in short-covering/consolidation. Meanwhile, any fresh tests above 16.4000 should meet renewed selling interest beneath 16.5000.