Published: 2026-02-25T16:51:58.000Z
Chart USD/CAD Update: Balanced beneath resistance - studies improving
1
Still little change, as prices extend consolidation
| Levels | Imp | Comment | Levels | Imp | Comment | |||
|---|---|---|---|---|---|---|---|---|
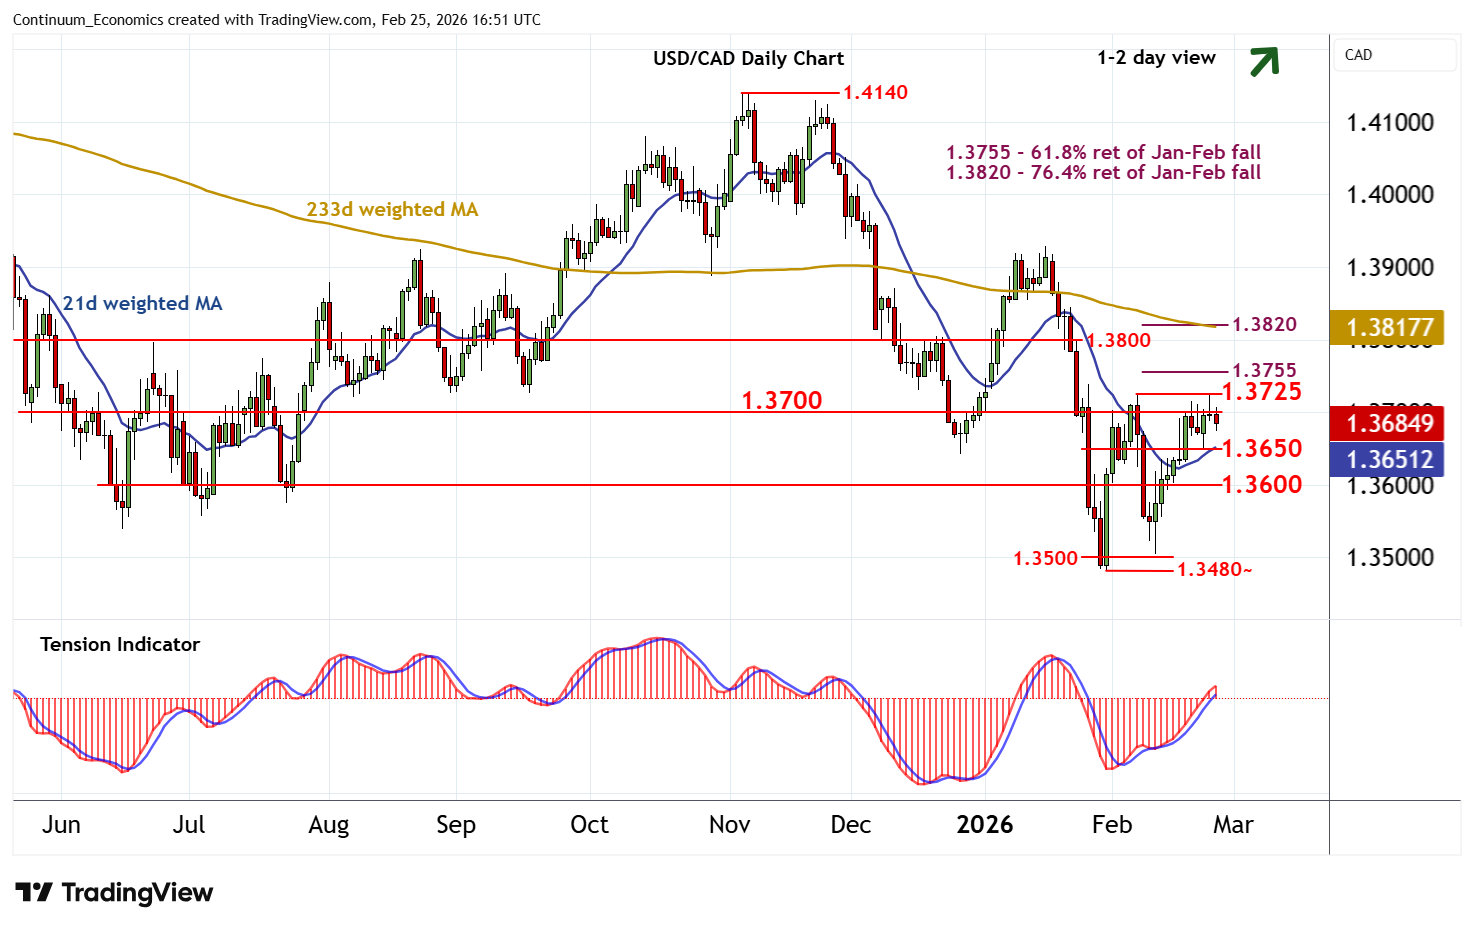
| R4 | 1.3800 | ** | congestion | S1 | 1.3650 | minor congestion | ||
| R3 | 1.3755 | ** | 61.8% ret of Jan-Feb fall | S2 | 1.3600 | * | congestion | |
| R2 | 1.3725 | * | 6 Feb (w) high | S3 | 1.3500 | ** | congestion | |
| R1 | 1.3700 | * | congestion | S4 | 1.3480~ | ** | 30 Jan YTD low |
Asterisk denotes strength of level
16:35 GMT - Still little change, as prices extend consolidation following the test of resistance at congestion around 1.3700 and the 1.3725 weekly high of 6 February. The daily Tension Indicator continues to rise and overbought daily stochastics have also ticked up, highlighting potential for a test above here, with focus to then turn to the 1.3755 Fibonacci retracement. However, initial tests could give way to consolidation. Meanwhile, support remains at congestion around 1.3650. A break beneath here, if seen, should give way to consolidation above further congestion around 1.3600.