Published: 2025-05-13T07:28:59.000Z
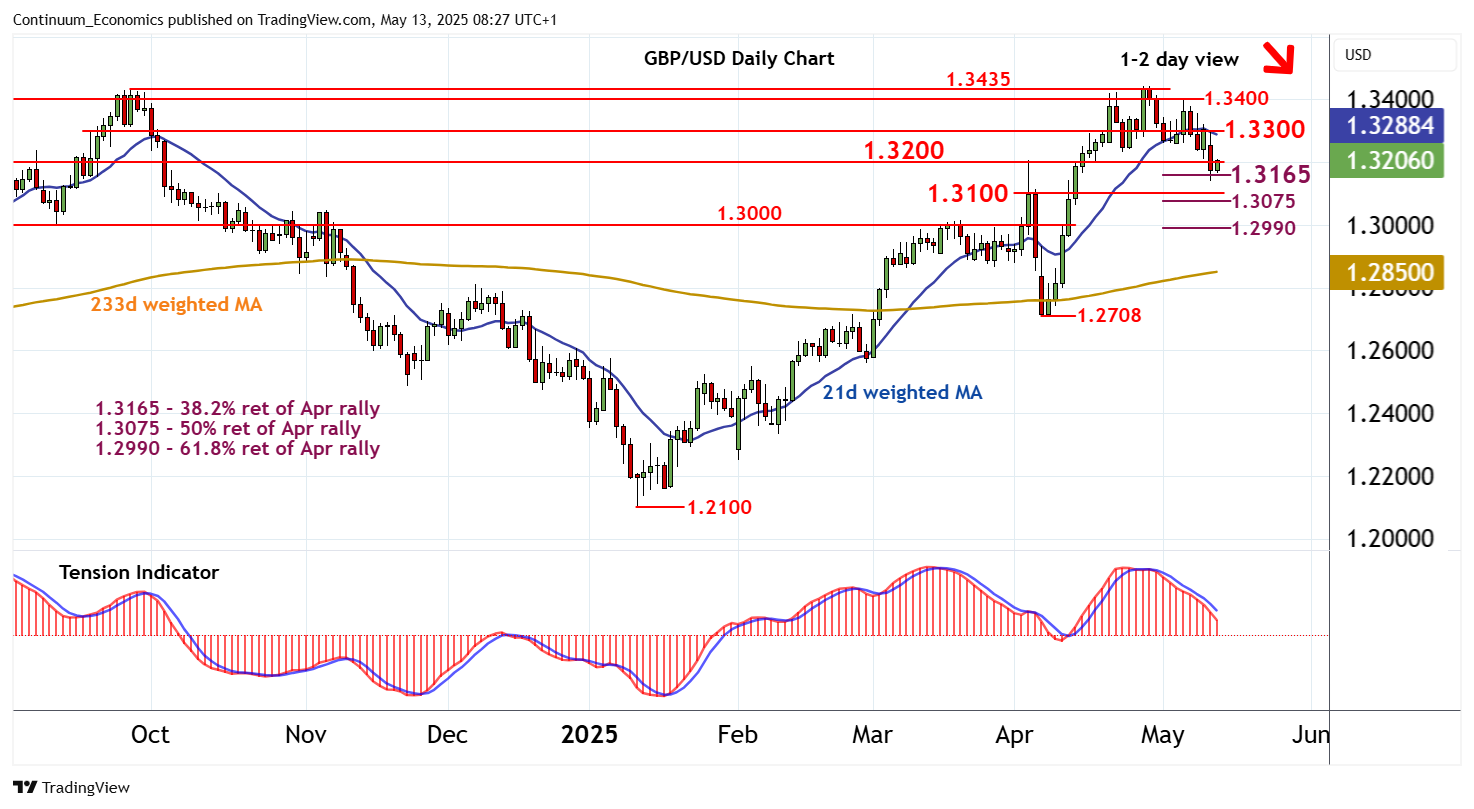
Chart GBP/USD Update: Consolidating test of the 1.3165 Fibonacci retracement

Senior Technical Strategist
-
The anticipated test of support at the 1.3165 Fibonacci retracement is giving way to consolidation
| Level | Comment | Level | Comment | |||||
|---|---|---|---|---|---|---|---|---|
| R4 | 1.3435 | ** | 26 Sep 2024 (y) high | S1 | 1.3165 | ** | 38.2% ret of Apr rally | |
| R3 | 1.3400 | congestion | S2 | 1.3100 | * | break level | ||
| R2 | 1.3300 | break level | S3 | 1.3075 | ** | 50% ret of Apr rally | ||
| R1 | 1.3200 | ** | break level | S4 | 1.2990/00 | ** | 61.8% ret; congestion |
Asterisk denotes strength of level
08:10 BST - The anticipated test of support at the 1.3165 Fibonacci retracement is giving way to consolidation, as intraday studies turn higher, with prices currently trading around resistance at 1.3200. Oversold daily stochastics are also flattening, suggesting potential for a test above here. But the bearish daily Tension Indicator and deteriorating weekly charts are expected to limit scope in renewed selling interest beneath 1.3300. Following corrective trade, fresh losses are looked for. But a close below 1.3165 is needed to turn sentiment negative and extend late-April losses towards 1.3100.