Published: 2025-09-12T08:27:06.000Z
Chart USD Index DXY Update: Range trade
0
2
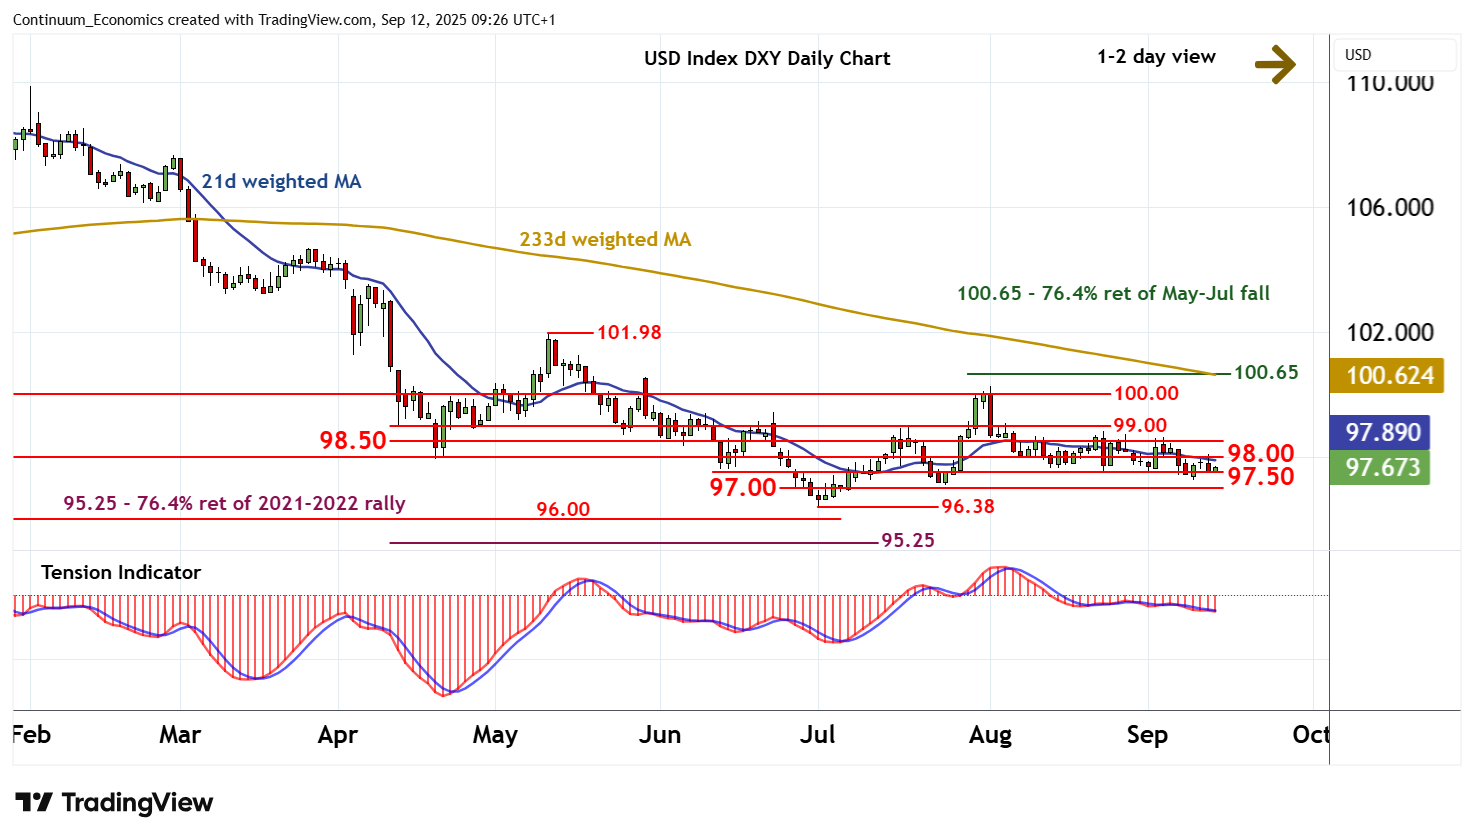
The test of congestion resistance at 98.00 has given way to a sharp pullback to congestion support at 97.50
| Levels | Imp | Comment | Levels | Imp | Comment | |||
|---|---|---|---|---|---|---|---|---|
| R4 | 100.00 | ** | break level | S1 | 97.50 | * | congestion | |
| R3 | 99.00 | * | break level | S2 | 97.00 | * | congestion | |
| R2 | 98.50 | congestion | S3 | 96.38 | ** | 1 Jul YTD low | ||
| R1 | 98.00 | * | congestion | S4 | 96.00 | * | historic congestion |
Asterisk denotes strength of level
09:05 BST - The test of congestion resistance at 98.00 has given way to a sharp pullback to congestion support at 97.50, where oversold intraday studies and rising daily stochastics are prompting consolidation. The daily Tension Indicator is ticking lower, pointing to room for a later test beneath here. But mixed weekly charts should limit initial scope in renewed consolidation above further congestion around 97.00. Meanwhile, any tests above 98.00 should give way to consolidation beneath 98.50.