Published: 2026-03-25T02:00:49.000Z
Chart GBP/USD Update: Still limited above 1.3400
4
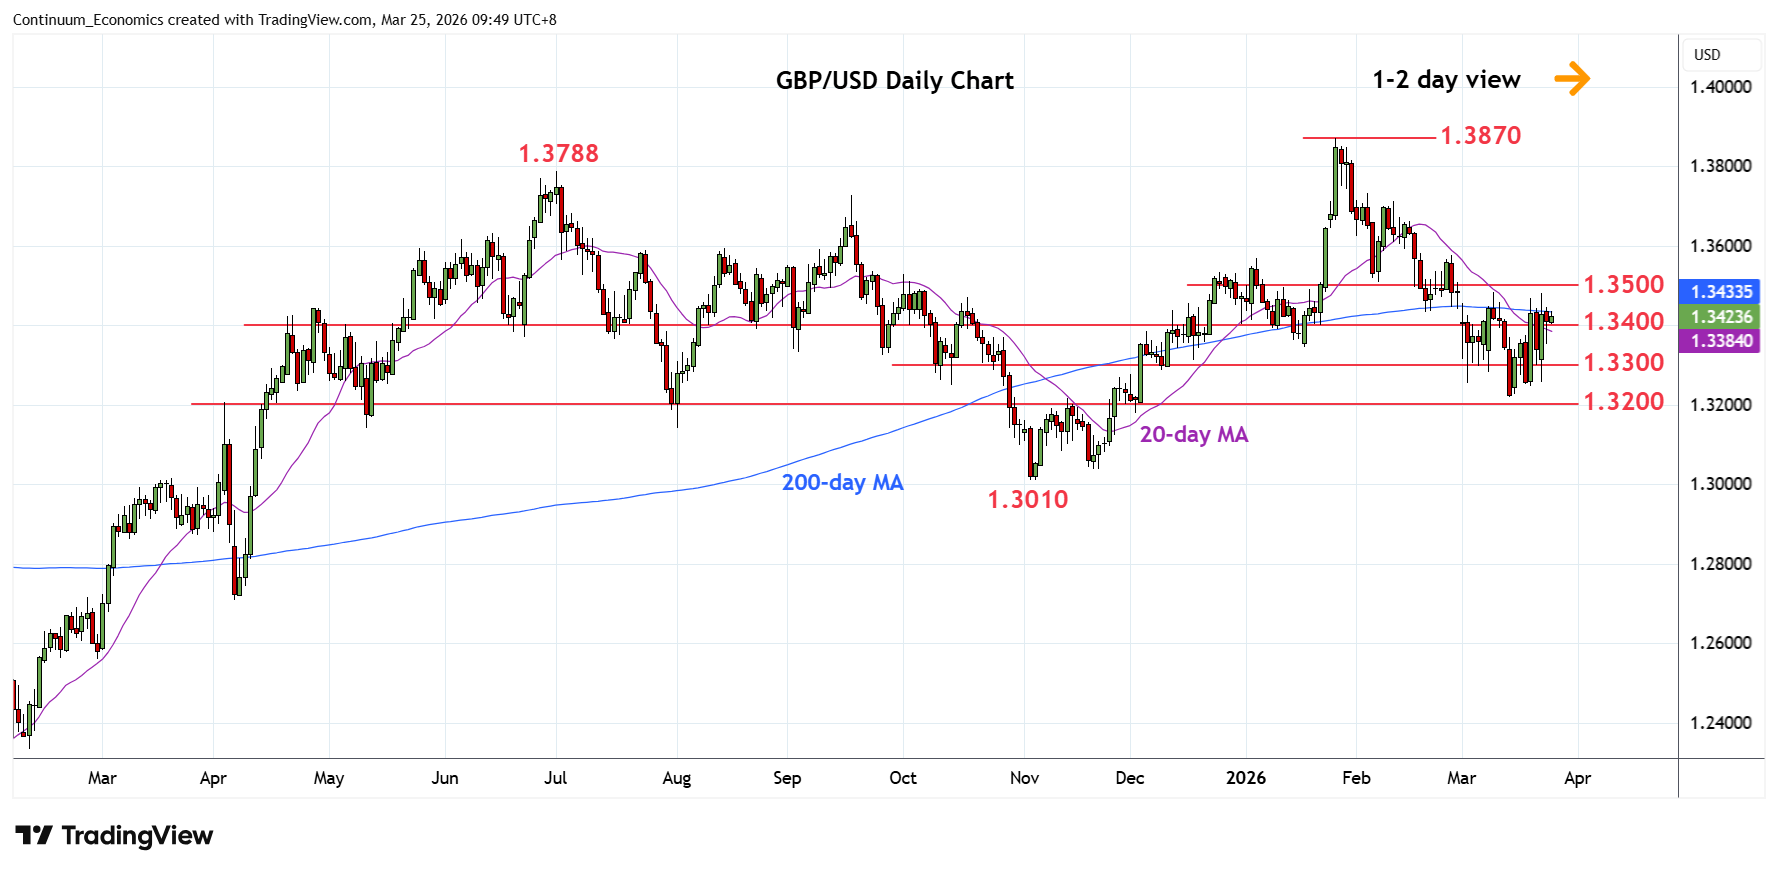
Still limited above the 1.3400 level as the 200-day MA at 1.3435 keep gains in check
| Level | Comment | Level | Comment | |||||
|---|---|---|---|---|---|---|---|---|
| R4 | 1.3600 | * | congestion | S1 | 1.3300 | * | congestion | |
| R3 | 1.3575 | * | 26 Feb high | S2 | 1.3250 | * | congestion | |
| R2 | 1.3500/10 | ** | congestion, 6 Feb low | S3 | 1.3213 | ** | 13 Mar YTD low | |
| R1 | 1.3435 | * | 200-day MA | S4 | 1.3200 | * | congestion |
Asterisk denotes strength of level
01:50 GMT - Still limited above the 1.3400 level as the 200-day MA at 1.3435 keep gains in check. Positive daily studies keep pressure on the upside and break here and the 1.3480 high will confirm a 3-week bottom pattern in place at the 1.3213 low and open up room to strong resistance at 1.3500/10 area. Clearance here revive the upside focus and see room to the 1.3600 level. Meanwhile, support remains at the 1.3350/1.3300 congestion area which should underpin and sustain bounce from the 1.3213, 13 March current year low.