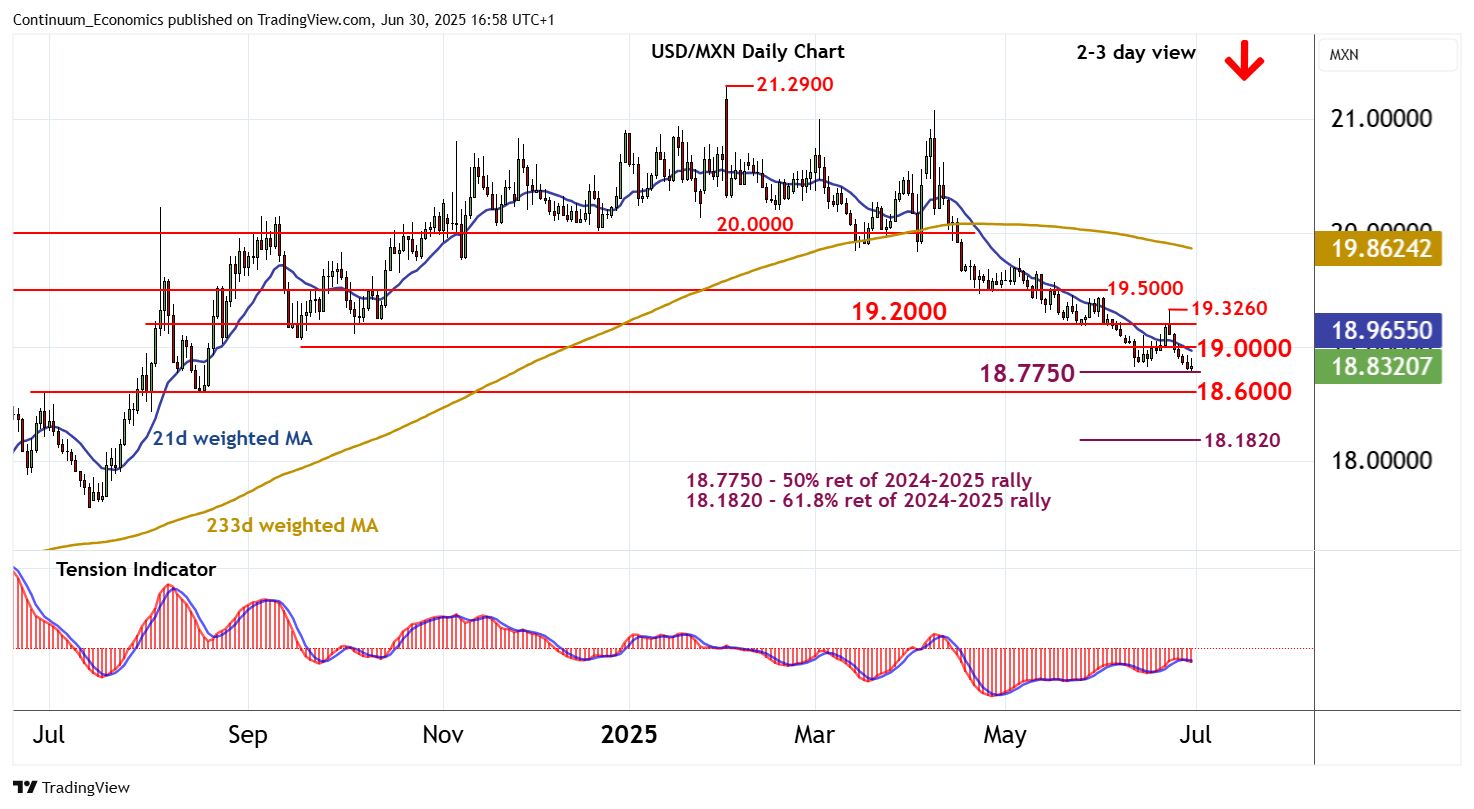
Chart USD/MXN Update: Pressuring the 18.7750 Fibonacci retracement

The fall from the 19.3260 weekly high of 23 June has reached critical support at the 18.7750 Fibonacci retracement
| Levels | Imp | Comment | Levels | Imp | Comment | |||
|---|---|---|---|---|---|---|---|---|
| R4 | 19.5000 | * | congestion | S1 | 18.7750 | ** | 50% ret of 2024-2025 rally | |
| R3 | 19.3260 | ** | 23 Jun (w) high | S2 | 18.6000 | ** | July-August 2024 break level | |
| R2 | 19.2000 | * | congestion | S3 | 18.4265 | 1 Aug 2024 (m) low | ||
| R1 | 19.0000 | * | congestion | S4 | 18.1820 | ** | 61.8% ret of 2024-2025 rally |
Asterisk denotes strength of level
16:40 BST - The fall from the 19.3260 weekly high of 23 June has reached critical support at the 18.7750 Fibonacci retracement, where rising intraday studies are prompting short-term reactions. Daily readings are under pressure and broader weekly charts are mixed/negative, highlighting room for still further losses in the coming sessions. A close beneath here will turn sentiment negative and extend February 2025 losses towards 18.6000. Meanwhile, resistance is lowered to congestion around 19.0000. A close above here, if seen, would help to stabilise price action and prompt consolidation beneath further congestion around 19.2000.