Published: 2026-02-25T01:47:48.000Z
Chart GBP/USD Update: Consolidating at the 1.3500 level
2
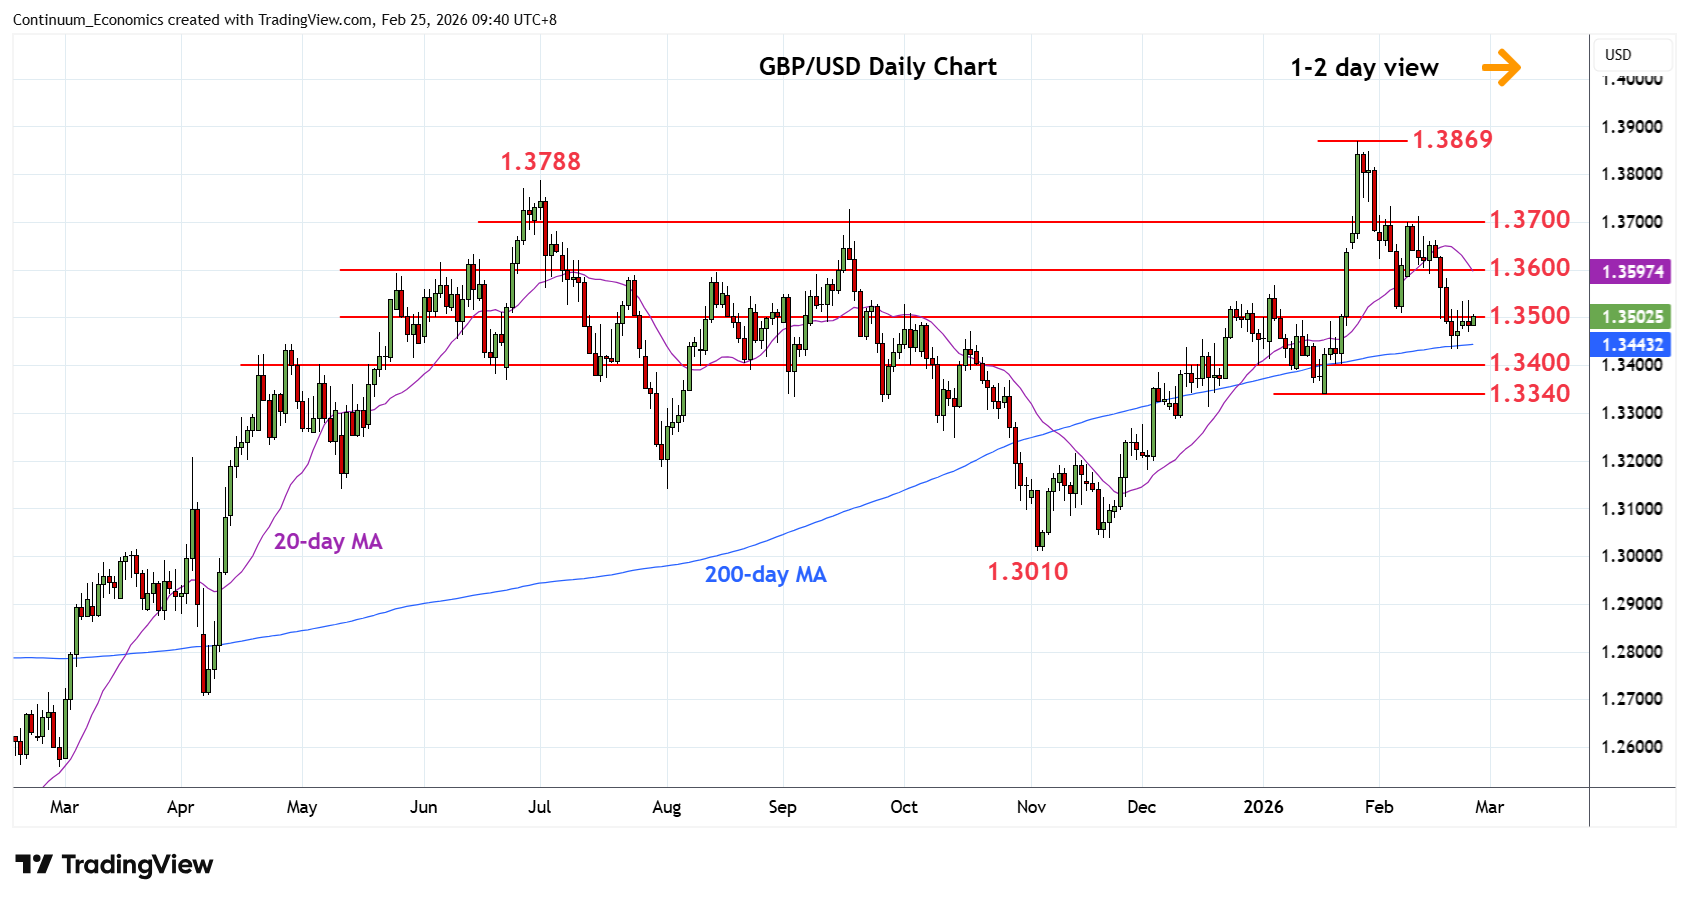
Little change, as prices extend consolidation at the 1.3500 level
| Level | Comment | Level | Comment | |||||
|---|---|---|---|---|---|---|---|---|
| R4 | 1.3788 | ** | Jul 2025 yr high | S1 | 1.3440 | * | 50% Nov/Jan rally | |
| R3 | 1.3700 | * | congestion | S2 | 1.3400 | * | congestion | |
| R2 | 1.3600/20 | ** | congestion | S3 | 1.3340 | ** | 19 Jan YTD low, 61.8% | |
| R1 | 1.3535 | * | 23 Feb high | S4 | 1.3300 | * | congestion |
Asterisk denotes strength of level
01:45 GMT - Little change, as prices extend consolidation at the 1.3500 level following bounce from the 1.3440/35 Fibonacci level and 200-day MA. Gains remain limited above the 1.3500 level and close above here and the 1.3535 Monday's high is needed to open up room for stronger gains to retrace the 2-week losses from the 1.3700 level. Clearance will see room to resistance at the 1.3600/50 congestion. Meanwhile, support at 1.3440/35 underpin. Would take break here to extend the January losses and open up room to the 1.3400 level and the 1.3340, 19 January YTD low and 61.8% Fibonacci level.