Published: 2026-01-16T09:18:22.000Z
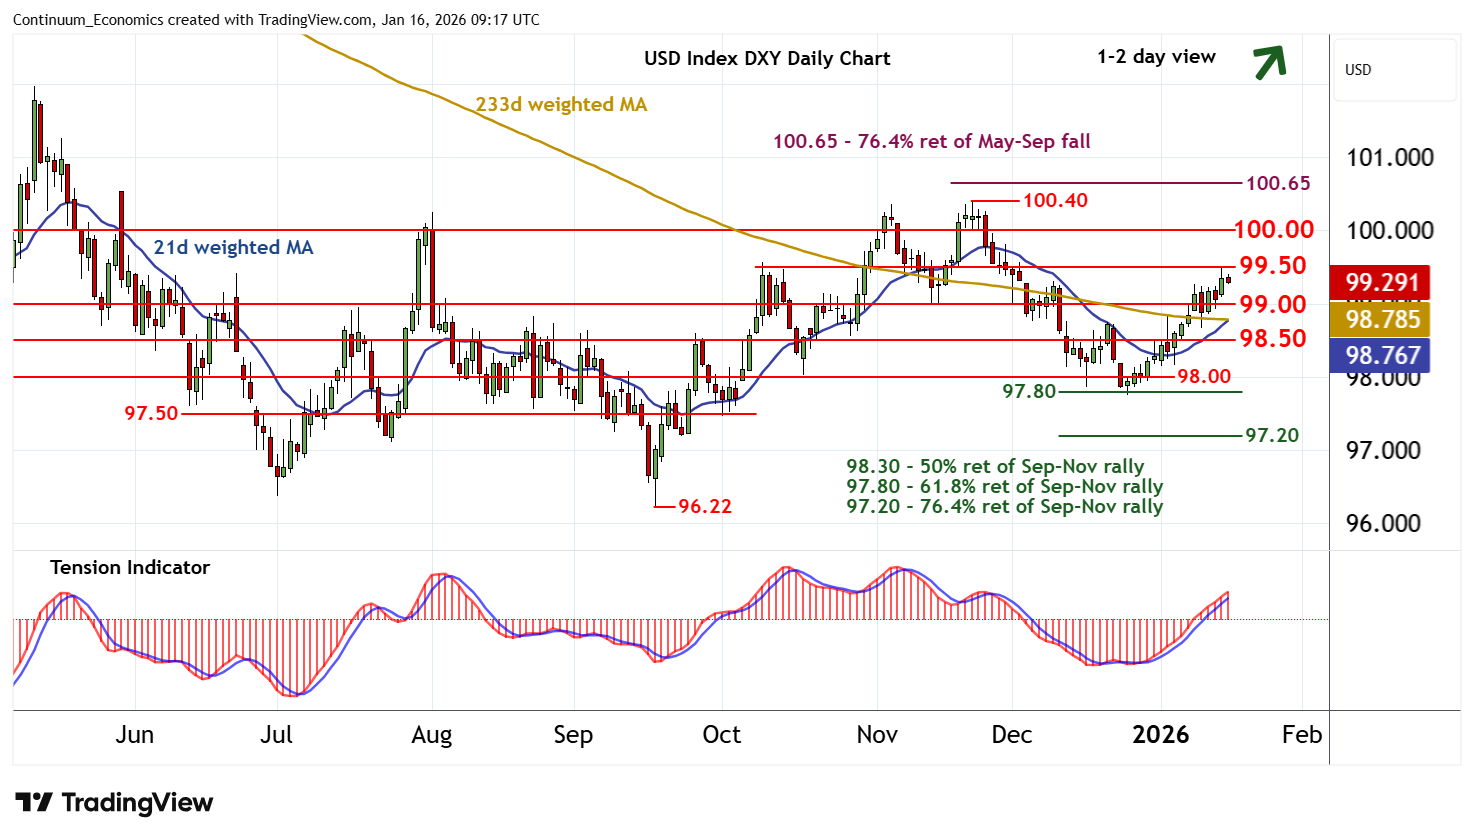
Chart USD Index DXY Update: Consolidating test of 99.50 - studies continue to rise
-
The anticipated test of resistance at 99.50 has given way to consolidation
| Levels | Imp | Comment | Levels | Imp | Comment | |||
|---|---|---|---|---|---|---|---|---|
| R4 | 100.65 | ** | 76.4% ret of May-Sep fall | S1 | 99.00 | * | congestion | |
| R3 | 100.40 | ** | 21 Nov (m) high | S2 | 98.50 | * | congestion | |
| R2 | 100.00 | ** | congestion | S3 | 98.00 | * | congestion | |
| R1 | 99.50 | * | break level | S4 | 97.80 | ** | 61.8% ret of Sep-Nov rally |
Asterisk denotes strength of level
09:05 GMT - The anticipated test of resistance at 99.50 has given way to consolidation, as overbought intraday studies unwind, with prices currently balanced around 99.30. The daily Tension Indicator continues to rise, highlighting room for a break above 99.50. But flat overbought daily stochastics and mixed weekly charts are expected to limit scope in renewed selling interest towards congestion around 100.00. Meanwhile, support remains at 99.00. A close beneath here would add weight to sentiment and prompt a pullback towards 98.50.