Published: 2026-02-23T00:23:56.000Z
Chart AUD/USD Update: Extend bounce from .7015 low
2
Extending bounce from the .7015 low of last week to retest the .7100 level
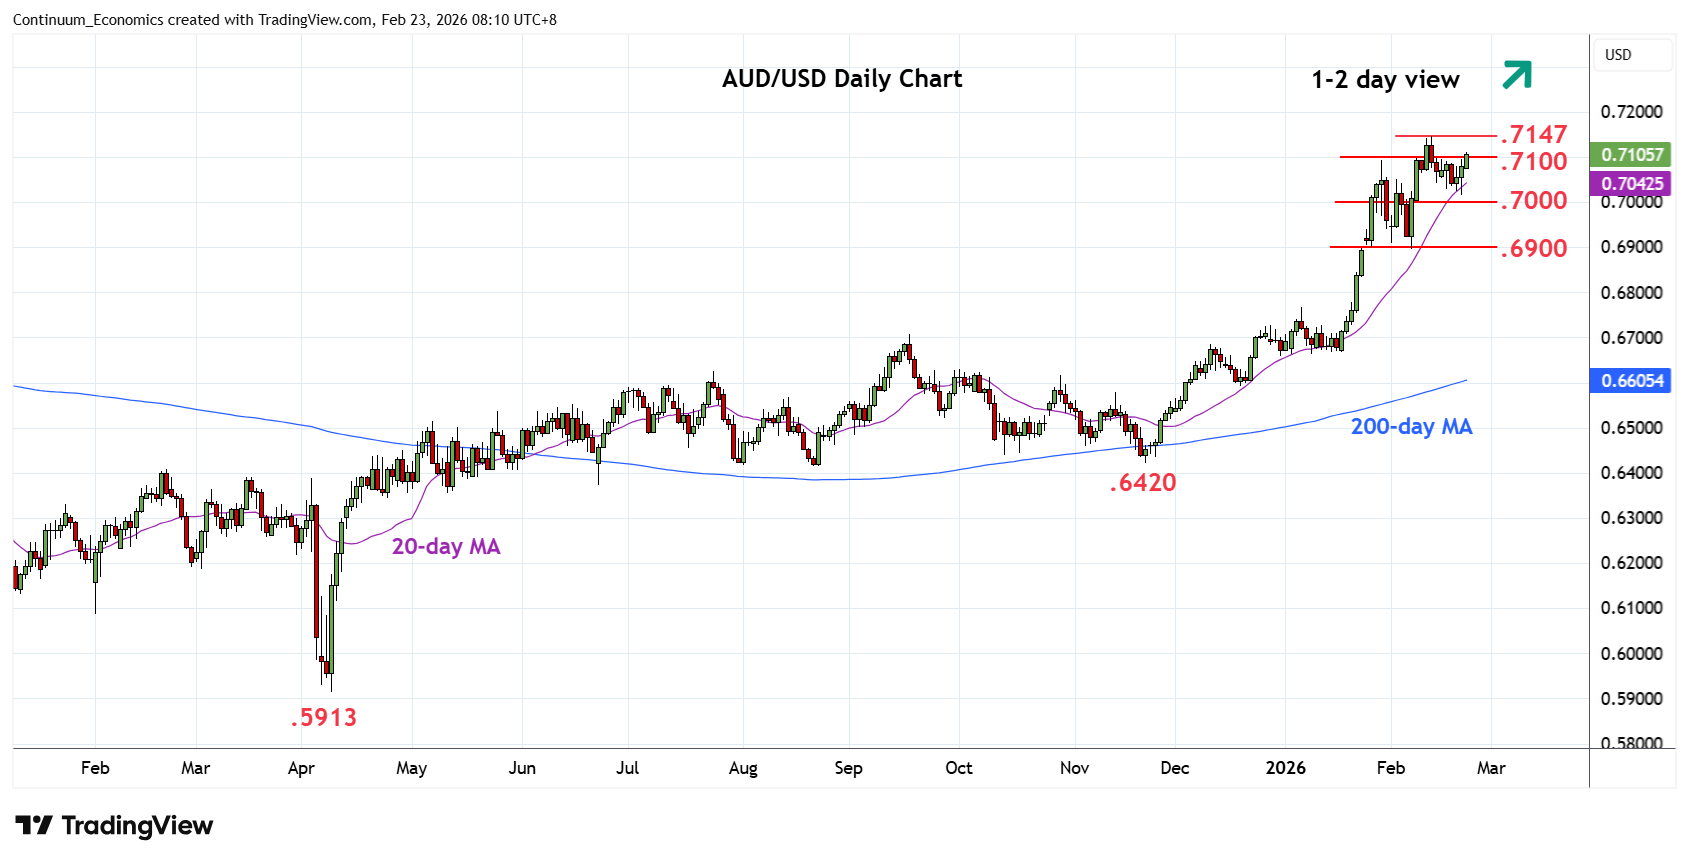
| Levels | Imp | Comment | Levels | Imp | Comment | |||
|---|---|---|---|---|---|---|---|---|
| R4 | 0.7280 | * | Jun 2022 high | S1 | 0.7015 | * | 20 Feb low | |
| R3 | 0.7205 | * | 61.8% 2021/2025 fall | S2 | 0.6900 | ** | congestion, 6 Feb low | |
| R2 | 0.7147 | ** | 12 Feb YTD high | S3 | 0.6870 | * | 38.2% Nov/Feb rally | |
| R1 | 0.7100 | * | congestion | S4 | 0.6800 | * | congestion |
Asterisk denotes strength of level
00:15 GMT - Extending bounce from the .7015 low of last week to retest the .7100 level. Break here will open up the .7147 high to retest and further extend gains from the April 2025 year low. Clearance here will further retrace the 2021/2025 losses and see room to .7205, 61.8% Fibonacci level. Higher still, will see scope for extension to resistance at .7280 high of June 2022. Meanwhile, support is at the .7015 low which should underpin. Would take break here to open up room for deeper pullback to retrace the November/February rally and see extension to strong support at the .6900 level and .6870, 38.2% Fibonacci level.